I have some points that made me realize recently that Supply&Demand areas of Sam Seiden have no more value then Techinical Analysis. It is actually just another facy name for Technical analysis, with exactly the same flaws, same subjectivity.
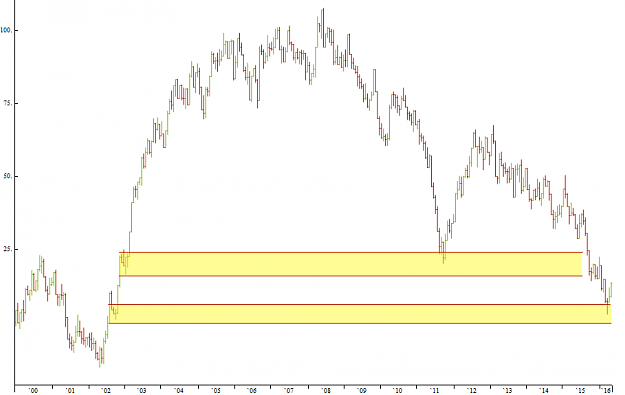
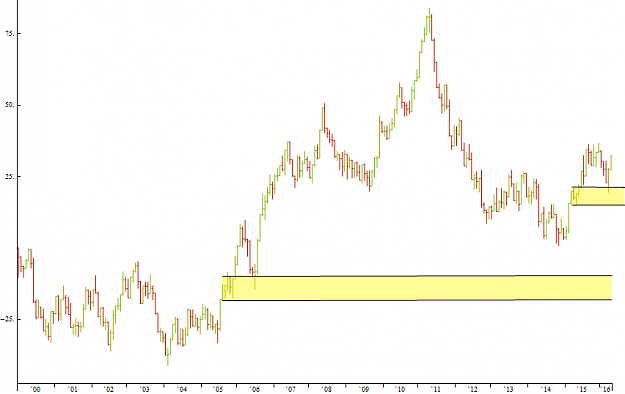
I've created these random walks.
I used a normal distribution to get the inputs for the random variables.
Markets can be modeled very realisticly using a normal distribution, although in reality they follow more a power rule distribution but in this case, its enough for what I am trying to show.
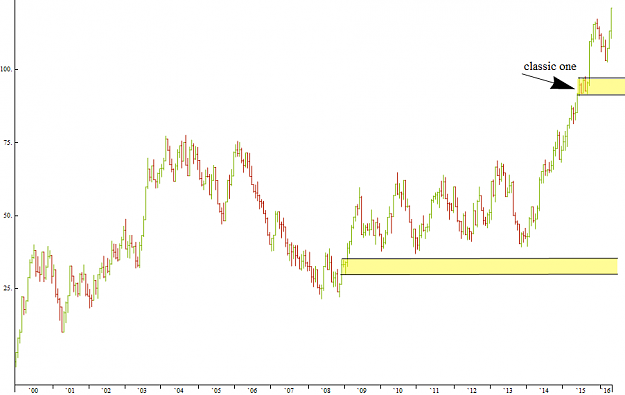
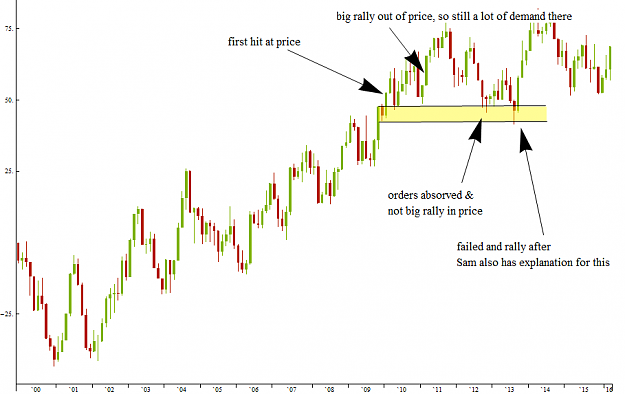
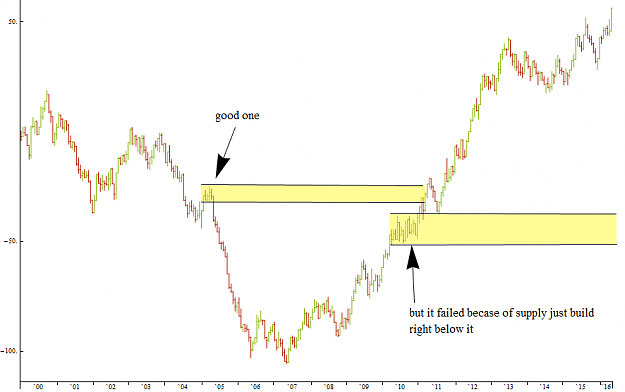
As you can see there are Supply and Demand areas just like the ones that Sam uses, he proclaims that those levels are filled with buy/sell orders and thats why price bounced out of it.
You can also see spikes into those areas that he says are the best thing to use to enter a trade when they hit.
http://s3.postimage.org/k4vml58i7/s_d1.jpg (http://postimage.org/image/k4vml58i7/)
He claims that institutions sometimes even drive prices to those areas on purpose so they can fill the rest of the orders (dealing desks are paid to fill orders at specific price ranges according to him), then at those levels retial traders think its going up/down so they send orders, and those dealers use those orders to fill their own opposite orders (I really find this hard to believe on itself, but becase I don't know what is happening on dealing desk and im very ignorant on that i just took his words for it).
He says he worked on CME and could see where the big instutitions were buying and selling (paper orders).
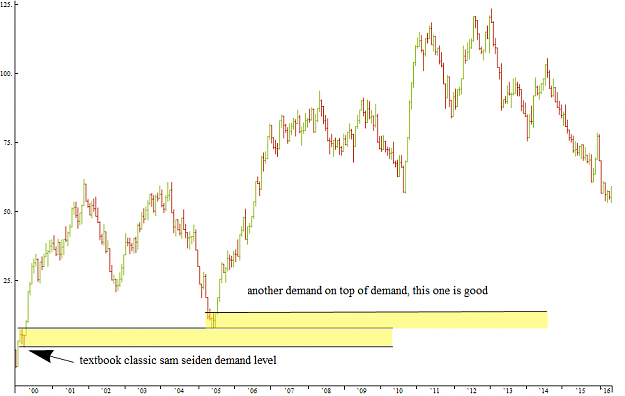
So he got the idea to see how those areas where big instutitons were buy&selling looked like on a price chart . so he come up with these levels. I asked him if he only uses a price chart to identify the levels, in which he said yes.
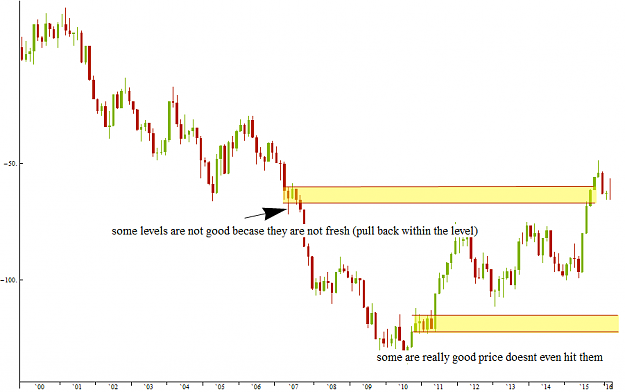
Another point. Sometimes he draws levels on areas that simply are just not what he claims to be a correct structually level. I mean he only draws that level becase price bounced out of it, only after the fact.. thats why he draws it. just note on his webinars and you can see it.
Levels that are complety the opposite of what he teaches to be structually correct on another webinars, complety contracdicting himself, and like he said, he only uses a chart identify those levels.
Anything that can be seen on a random chart does not imply that is not true or false. It just shows that in random data there are all those things too.
For example, I know people talk about stop losses orders getting triggered. I can see it being triggered on the tick chart for example. at places where you would expect to have stop loss orders. I have evidences that its true even though those phenomenons also appear in random walks.
If the levels he picked up could not been seen in random data then i would have at least a motivation to belive him.
Then there is the Online trading academy. where he teaches you everything that you will need to know, it is structured as a scheme like Scientology were you progress in a prynamid style thing, on each level you get to know even more about this stuff and how market works in general.
Why would you sell anything that is already profitibale? why would you create competition and risk it not to work anymore ? why not just get rich on it?
There are things that he says that are true about supply and demand. It is true that prices move becase of unbalances in supply/demand.
Scams normaly mix truth with falsewood to create illusion that everything is just fine. I think he is just another scammer. and he fooled a lot of people, even won educator of the year award at forexstreet, what more could you want if you had an academy to teach all this tricks.
People say they have been trading with him for years and its has been profitable has a defence, well i say to those people that there are also alot of people being profitbable with normal regular flawed nonsense TA and that doesnt mean what he teaches is any better than TA.
So in the end what all you have left its his word and nothing else. You belive him or not. I find it hard to belive after seeing this.
If you guys want more graphs as example just ask. I can generate as many as I want and ALL of them have Sam Seiden Supply&Demand areas.
http://s18.postimage.org/oiyql0jqd/s_d2.jpg (http://postimage.org/image/oiyql0jqd/)
http://s18.postimage.org/3ome36pd1/s_d4.jpg (http://postimage.org/image/3ome36pd1/)
http://s18.postimage.org/dv01jag2t/s_d11.jpg (http://postimage.org/image/dv01jag2t/)
http://s18.postimage.org/e91diw06d/s_d12.jpg (http://postimage.org/image/e91diw06d/)
I've created these random walks.
I used a normal distribution to get the inputs for the random variables.
Markets can be modeled very realisticly using a normal distribution, although in reality they follow more a power rule distribution but in this case, its enough for what I am trying to show.
Attached Image (click to enlarge)
Attached Image (click to enlarge)
Attached Image (click to enlarge)
Attached Image (click to enlarge)
Attached Image (click to enlarge)
Attached Image (click to enlarge)
Attached Image (click to enlarge)
As you can see there are Supply and Demand areas just like the ones that Sam uses, he proclaims that those levels are filled with buy/sell orders and thats why price bounced out of it.
You can also see spikes into those areas that he says are the best thing to use to enter a trade when they hit.
http://s3.postimage.org/k4vml58i7/s_d1.jpg (http://postimage.org/image/k4vml58i7/)
He claims that institutions sometimes even drive prices to those areas on purpose so they can fill the rest of the orders (dealing desks are paid to fill orders at specific price ranges according to him), then at those levels retial traders think its going up/down so they send orders, and those dealers use those orders to fill their own opposite orders (I really find this hard to believe on itself, but becase I don't know what is happening on dealing desk and im very ignorant on that i just took his words for it).
He says he worked on CME and could see where the big instutitions were buying and selling (paper orders).
So he got the idea to see how those areas where big instutitons were buy&selling looked like on a price chart . so he come up with these levels. I asked him if he only uses a price chart to identify the levels, in which he said yes.
Another point. Sometimes he draws levels on areas that simply are just not what he claims to be a correct structually level. I mean he only draws that level becase price bounced out of it, only after the fact.. thats why he draws it. just note on his webinars and you can see it.
Levels that are complety the opposite of what he teaches to be structually correct on another webinars, complety contracdicting himself, and like he said, he only uses a chart identify those levels.
Anything that can be seen on a random chart does not imply that is not true or false. It just shows that in random data there are all those things too.
For example, I know people talk about stop losses orders getting triggered. I can see it being triggered on the tick chart for example. at places where you would expect to have stop loss orders. I have evidences that its true even though those phenomenons also appear in random walks.
If the levels he picked up could not been seen in random data then i would have at least a motivation to belive him.
Then there is the Online trading academy. where he teaches you everything that you will need to know, it is structured as a scheme like Scientology were you progress in a prynamid style thing, on each level you get to know even more about this stuff and how market works in general.
Why would you sell anything that is already profitibale? why would you create competition and risk it not to work anymore ? why not just get rich on it?
There are things that he says that are true about supply and demand. It is true that prices move becase of unbalances in supply/demand.
Scams normaly mix truth with falsewood to create illusion that everything is just fine. I think he is just another scammer. and he fooled a lot of people, even won educator of the year award at forexstreet, what more could you want if you had an academy to teach all this tricks.
People say they have been trading with him for years and its has been profitable has a defence, well i say to those people that there are also alot of people being profitbable with normal regular flawed nonsense TA and that doesnt mean what he teaches is any better than TA.
So in the end what all you have left its his word and nothing else. You belive him or not. I find it hard to belive after seeing this.
If you guys want more graphs as example just ask. I can generate as many as I want and ALL of them have Sam Seiden Supply&Demand areas.
http://s18.postimage.org/oiyql0jqd/s_d2.jpg (http://postimage.org/image/oiyql0jqd/)
http://s18.postimage.org/3ome36pd1/s_d4.jpg (http://postimage.org/image/3ome36pd1/)
http://s18.postimage.org/dv01jag2t/s_d11.jpg (http://postimage.org/image/dv01jag2t/)
http://s18.postimage.org/e91diw06d/s_d12.jpg (http://postimage.org/image/e91diw06d/)
"You're solid gold, see you in hell"