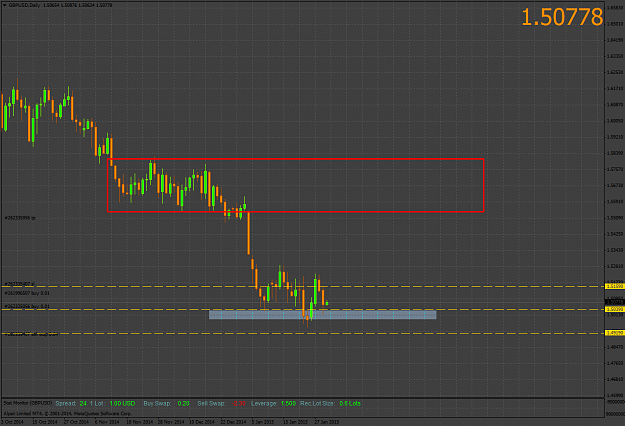
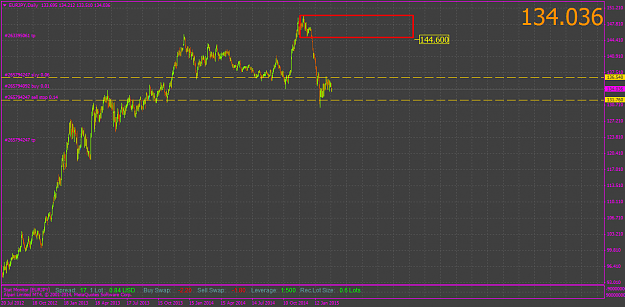
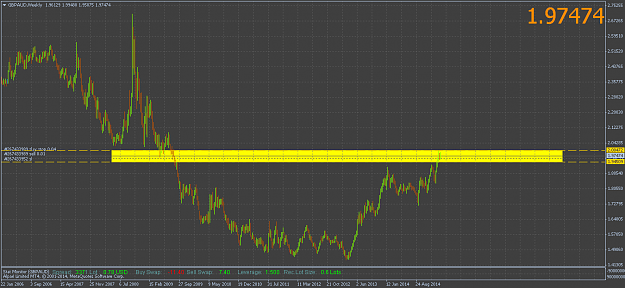
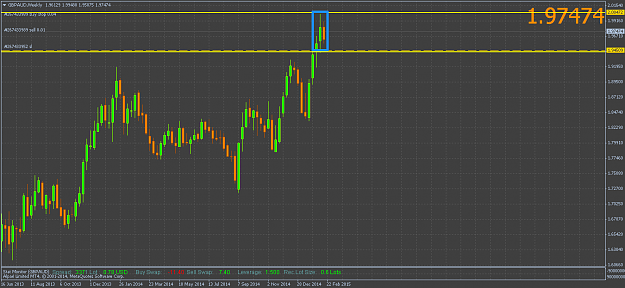
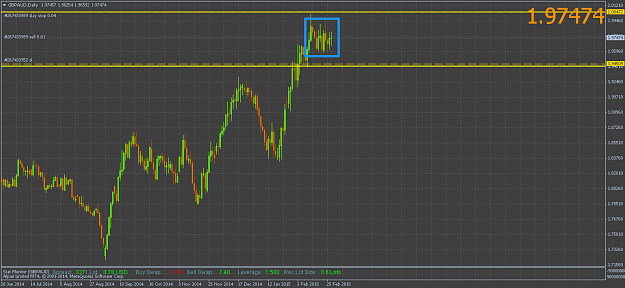
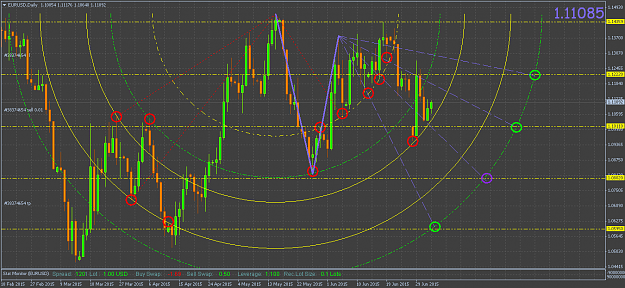
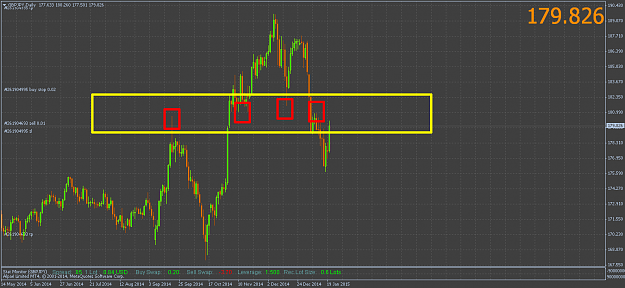
GBPJPY ... This pair has always amazed me with its potential. While watching the daily chart I noticed the resistence/support zone which has been tested several times in the past which means 4x confirmed horizantal zone. Just shown as below :
On the other side , just by placing a fibo on the last downtrend I wanted to see if significant fibo levels settle on some important support / resistence levels. And what i saw is the fib %50 level exactly fits on the resistence zone where I was expecting the bears to say "stop".
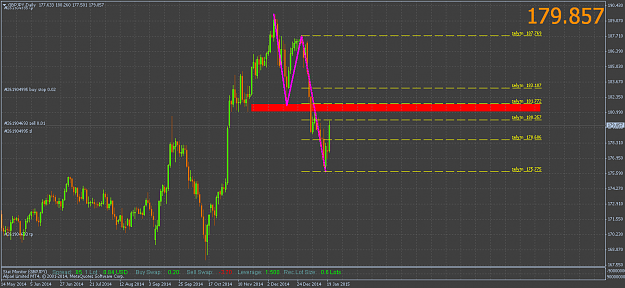
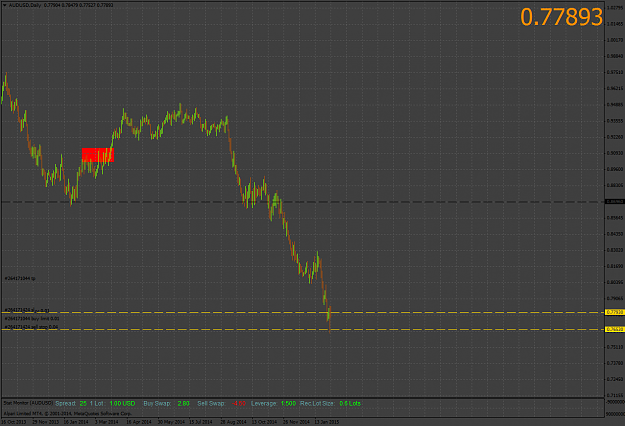
Anyway , after determining the avarage daily range for the price and deciding the SL amount, I placed a 0,01 SELL order. We ll see what happens.
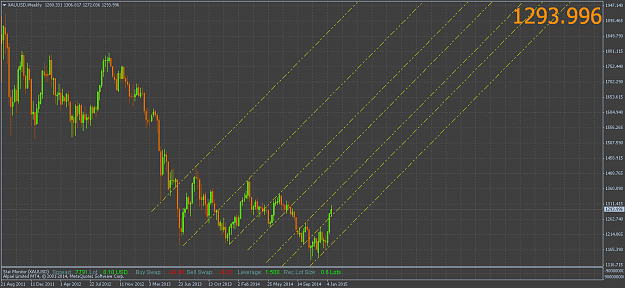
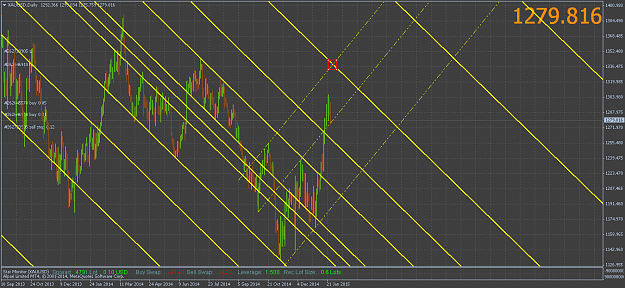
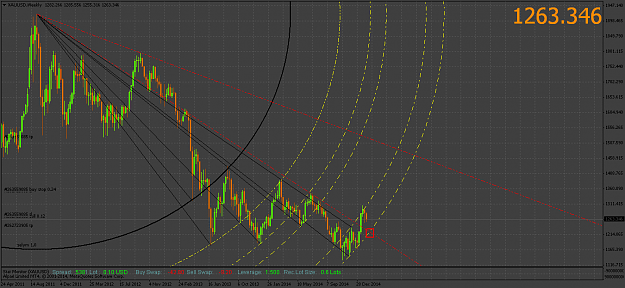
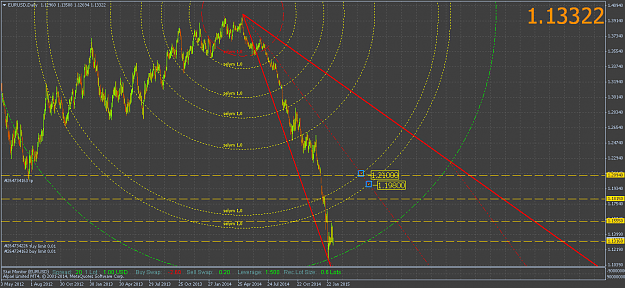
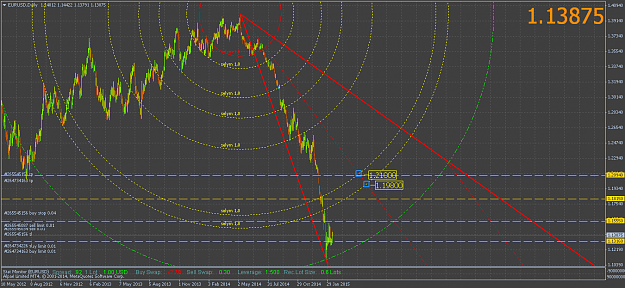
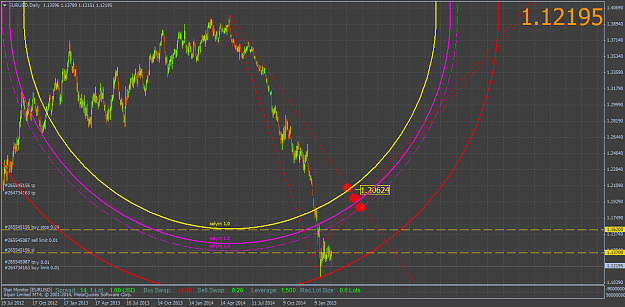
Is the price a slave of this giant "stage" ??
Attached Image (click to enlarge)
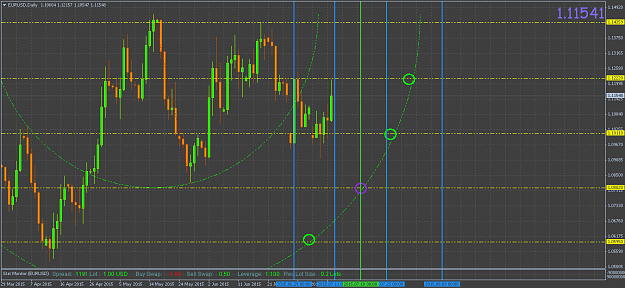
On the other side , just by placing a fibo on the last downtrend I wanted to see if significant fibo levels settle on some important support / resistence levels. And what i saw is the fib %50 level exactly fits on the resistence zone where I was expecting the bears to say "stop".
Attached Image (click to enlarge)
Anyway , after determining the avarage daily range for the price and deciding the SL amount, I placed a 0,01 SELL order. We ll see what happens.
Is the price a slave of this giant "stage" ??
Imagination rules the world ...