Actual Volume Spread Analysis. And by that I mean, I am looking at Volume.
I am on the Bearish Side now.
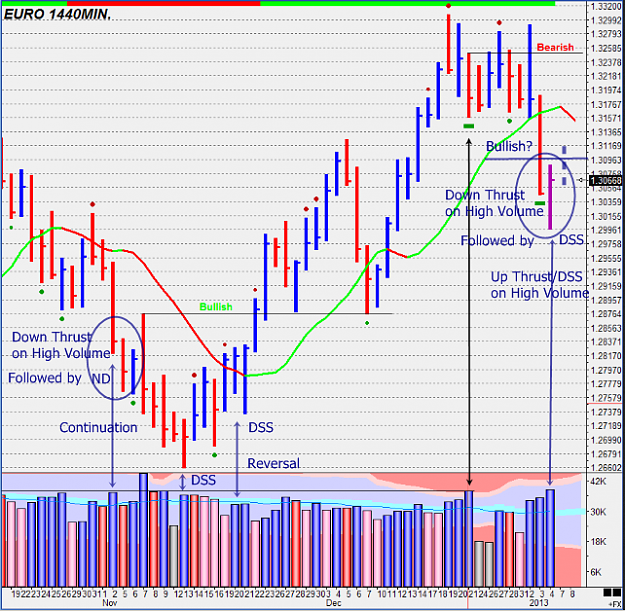
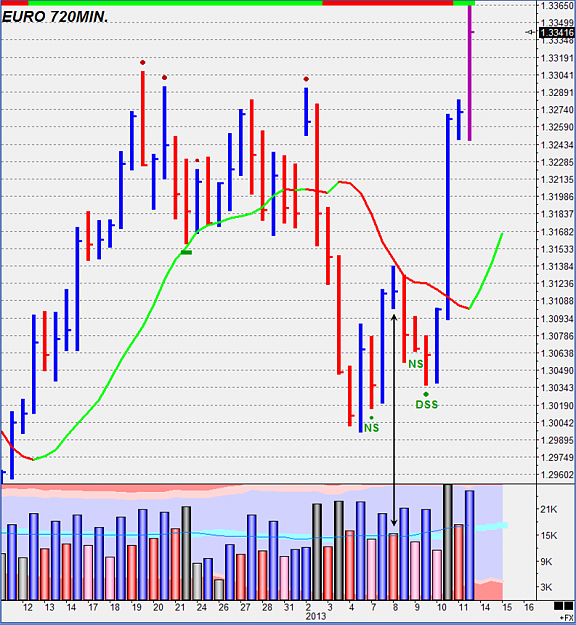
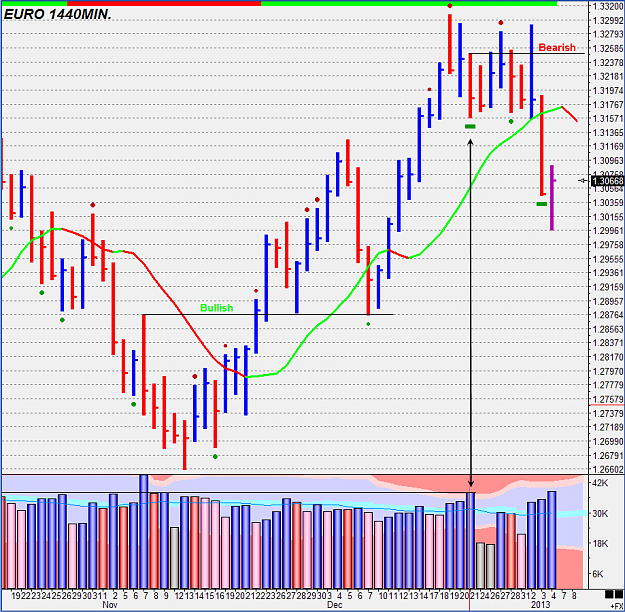
Take a look at this 1440 minute chart.
Of course, I use 12 minute and 3 minute to trade, so there may well be opportunites to get long.........
As for the bigger picture, Note the double arrow. This points to what was the second highest volume bar on the chart until friday. This bar closed off its low on Ultra High Volume. The next bar was down but it was down on volume less than the previous two intervals. This tells me that there must have been some buying on the first interval.
If this bar was bullish, then we would expect that price would be able to close above the high of this interval. Notice that price trades above but never closes above it. In fact we had two clear signs of weakness appear as price traded above the high only to close well below it. Then we had a wide spread down bar on Ultra High Volume that closed well below the low of this bar. Said down bar that closed on its lows, in fact takes out the low of a number of bars. This is bearish.
Take a look at the highest volume bar that can be seen on the chart. Note the price action the very first time price gets above its high.
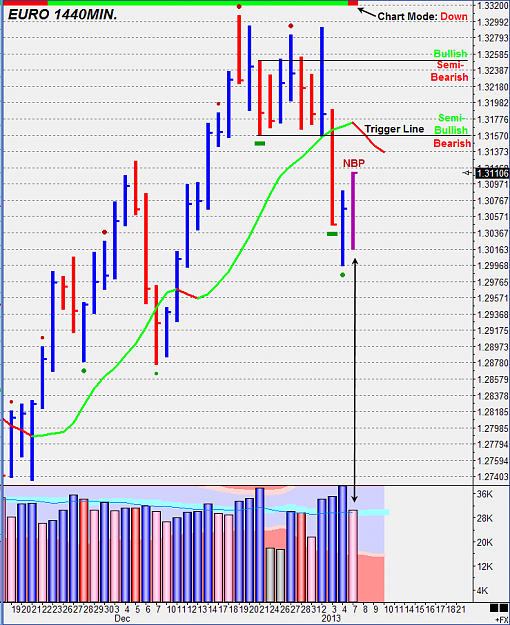
Now, If one only trades the 1440 minute chart, one does need to wait for the chart mode to change. And the prefered narrow range up bar on volume less than the previous two intervals (ND). A wide spread up bar that closes well off its lows would be good too (Up Thrust).
The volume on the last interval is Ultra High. This may well be a failed Test.
I am on the Bearish Side now.
Take a look at this 1440 minute chart.
Of course, I use 12 minute and 3 minute to trade, so there may well be opportunites to get long.........
As for the bigger picture, Note the double arrow. This points to what was the second highest volume bar on the chart until friday. This bar closed off its low on Ultra High Volume. The next bar was down but it was down on volume less than the previous two intervals. This tells me that there must have been some buying on the first interval.
If this bar was bullish, then we would expect that price would be able to close above the high of this interval. Notice that price trades above but never closes above it. In fact we had two clear signs of weakness appear as price traded above the high only to close well below it. Then we had a wide spread down bar on Ultra High Volume that closed well below the low of this bar. Said down bar that closed on its lows, in fact takes out the low of a number of bars. This is bearish.
Take a look at the highest volume bar that can be seen on the chart. Note the price action the very first time price gets above its high.
Now, If one only trades the 1440 minute chart, one does need to wait for the chart mode to change. And the prefered narrow range up bar on volume less than the previous two intervals (ND). A wide spread up bar that closes well off its lows would be good too (Up Thrust).
The volume on the last interval is Ultra High. This may well be a failed Test.
Attached Image (click to enlarge)
Wyckoff VSA: (1) Supply & Demand (2) Effort vs. Result (3) Cause & Effect