Hello all.<?xml:namespace prefix = o ns = "urn:schemas-microsoft-com:office:office" /><o ></o>
></o>
I’m starting this new thread to show my system. I have been trading stocks for 2 years, and have now started to trade currencies. I am always learning, and still have to learn a lot. I post this because people can test the system, give advice, and also I can perhaps help people. This system may provide some ideas. This system may be modified by anyone, but please share what you modified. English is not my primary language, so please don’t blame me for any mistakes.<o></o>
<o></o>
(I am not responsible for any loss anyone makes with this system)<o></o>
Ok let’s get started. This is how it works:<o></o>
First set up the proper chart for this system. Take a chart of the GBP/USD with an one hour interval. I would not take a shorter time frame, this leads to more whipsaws. Personally I use only GBP/USD. However, it can be used on other currencies. In my opinion GBP/USD is best.<o></o>
Next, plot a 10 period EMA, a 25 period EMA, and a 50 period EMA. <o></o>
<o></o>
These are the rules:<o></o>
-Go long when EMA10 rises above EMA25 and EMA 50 consecutively.<o></o>
-Go short when EMA 10 falls beneath EMA25 and EMA 50 consecutively.<o></o>
<o></o>
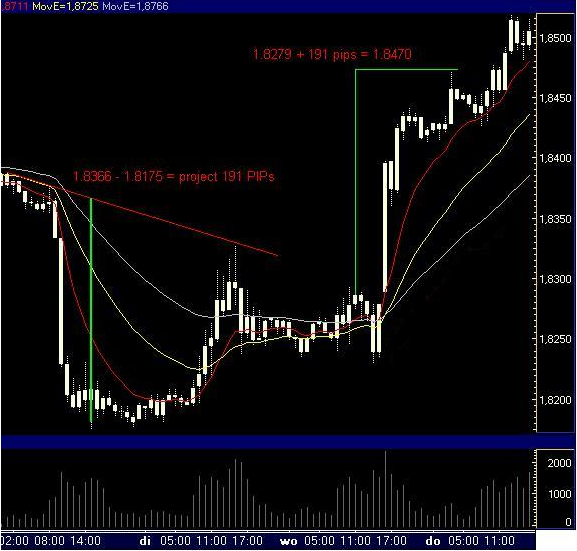
Now the exit. To determine the take profit, we must do some simple technical analysis by hand. <o></o>
If you are long, take 2 of the last tops, and look at the maximum move beneath those tops.<o></o>
If you are short, take 2 of the last bottoms, and look at the maximum move above those bottoms. Now calculate the difference between that maximum move and the trend line you have. Then project this at the level where the EMA10 crossed the EMA25.<o></o>
This part of the system is very similar to Mouteki rules. Therefore, any honour for this part of the system goes to Moutekitrader, and not to me. It is not my intention to steal systems. I use these exit rules because they are crucial for the system. <o></o>
<o></o>
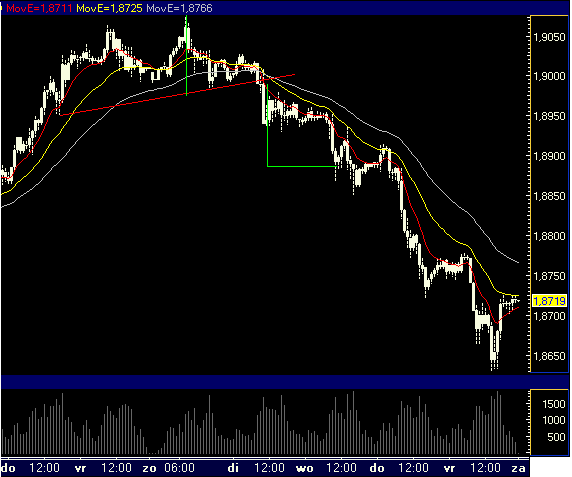
That is one possibility to exit the trade. However, sometimes the target is not being reached. Always sell your positions when EMA10 crosses EMA25 in the opposite position of your trade. <o></o>
<o></o>
This system doesn’t get every pip. EMA’s are lagging indicators. My intention is to make a good profit, not to scalp out every PIP.<o></o>
<o></o>
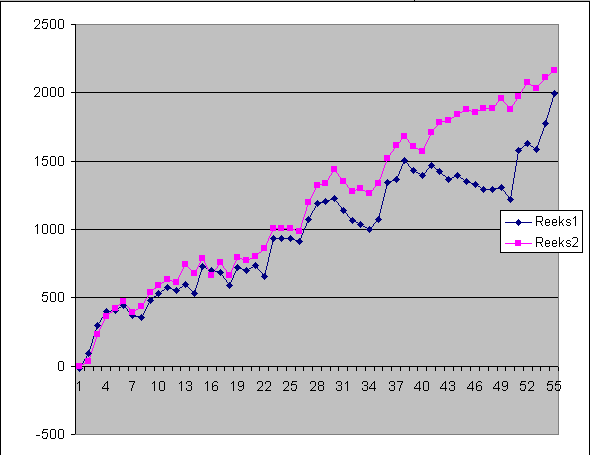
As attachment I have an example of a trade, and a chart with the profit in pips. The blue line is the profit if you sell each time when EMA10 crosses under EMA25 only! The pink line is the profit if you sell each time using the rules said: at take profit projection, and sometimes EMA 10/25 cross if that occurs before the projection target has been reached. This shows several things, 1. the system is profitable, 2. using the projection technique is better than just selling if EMA crosses… The number you see left on the chart is the profit in PIPs. There were 55 trades from 1 march till now.
Having said all, I hope there will be a good discussion. <o></o>
Bye!
PS Sorry for the bad quality of the pictures, I will post some better ones soon.
I’m starting this new thread to show my system. I have been trading stocks for 2 years, and have now started to trade currencies. I am always learning, and still have to learn a lot. I post this because people can test the system, give advice, and also I can perhaps help people. This system may provide some ideas. This system may be modified by anyone, but please share what you modified. English is not my primary language, so please don’t blame me for any mistakes.<o
<o
(I am not responsible for any loss anyone makes with this system)<o
Ok let’s get started. This is how it works:<o
First set up the proper chart for this system. Take a chart of the GBP/USD with an one hour interval. I would not take a shorter time frame, this leads to more whipsaws. Personally I use only GBP/USD. However, it can be used on other currencies. In my opinion GBP/USD is best.<o
Next, plot a 10 period EMA, a 25 period EMA, and a 50 period EMA. <o
<o
These are the rules:<o
-Go long when EMA10 rises above EMA25 and EMA 50 consecutively.<o
-Go short when EMA 10 falls beneath EMA25 and EMA 50 consecutively.<o
<o
Now the exit. To determine the take profit, we must do some simple technical analysis by hand. <o
If you are long, take 2 of the last tops, and look at the maximum move beneath those tops.<o
If you are short, take 2 of the last bottoms, and look at the maximum move above those bottoms. Now calculate the difference between that maximum move and the trend line you have. Then project this at the level where the EMA10 crossed the EMA25.<o
This part of the system is very similar to Mouteki rules. Therefore, any honour for this part of the system goes to Moutekitrader, and not to me. It is not my intention to steal systems. I use these exit rules because they are crucial for the system. <o
<o
That is one possibility to exit the trade. However, sometimes the target is not being reached. Always sell your positions when EMA10 crosses EMA25 in the opposite position of your trade. <o
<o
This system doesn’t get every pip. EMA’s are lagging indicators. My intention is to make a good profit, not to scalp out every PIP.<o
<o
As attachment I have an example of a trade, and a chart with the profit in pips. The blue line is the profit if you sell each time when EMA10 crosses under EMA25 only! The pink line is the profit if you sell each time using the rules said: at take profit projection, and sometimes EMA 10/25 cross if that occurs before the projection target has been reached. This shows several things, 1. the system is profitable, 2. using the projection technique is better than just selling if EMA crosses… The number you see left on the chart is the profit in PIPs. There were 55 trades from 1 march till now.
Having said all, I hope there will be a good discussion. <o
Bye!
PS Sorry for the bad quality of the pictures, I will post some better ones soon.
Attached Images