The development of this system was sponsored by oP group Germany, a service specialized in programming efficient trading systems and EAs, artificial intelligence algorithms, robots, platforms and backtest tools, custom-fit to your trading needs.
Ok, that was the advertisement. Now I'm going to describe the rules of the 100% system and the theory behind it. You can code it yourself, or run it manually as the rules are rather simple, or follow it on Zulu, or you can download it from the link below. The system has been backtested with 3 years data and so far traded live for 1 year.
At first glance, 100% win rate seems suspicious. If such a system existed, why isn't anyone trading it? In fact it's not very difficult to develop a system that produces 100% win rate for some time. But such methods are normally high risk and thus rely on trader's luck. Problem with luck is that you never know when you run out of it. The algorithm presented here however bears low risk and does not rely on luck. It also uses no indicators or "technical analysis" stuff. Still, it generates 200% annual return in live trading so far, and can be traded with very low capital, such as $ 200. So, it's not the holy grail, but it's a pretty good system.
A little theory. We're not looking here into some little nooks and crannies of a price curve, but into the market as a whole. All rational trade systems exploit market inefficiencies. Unfortunately most such inefficiencies are shortlived, that's why a system can work well one year and produce huge losses in the next year. However there are also some long term market inefficiencies that allow stable and solid systems. A very interesting inefficiency is visible in the chart below:
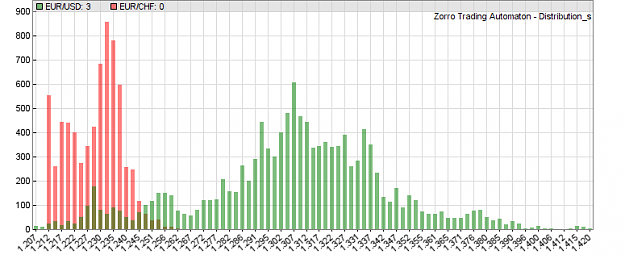
This is a price distribution chart, it shows the frequency of prices during a certain time period. The red bars are based on the EUR prices in Swiss Francs (EUR/CHF) since October 2011. For comparison, the green bars are the EUR prices in US Dollars (EUR/USD) in the same time period.
It is clear to see that the red EUR/CHF price distribution is narrow and not bell shaped, i.e. non-Gaussian. Prices appear to oscillate between two levels. In comparison, the green EUR/USD distribution is wide and approximately Gaussian. A non-Gaussian price distribution is often the indicator of a market inefficiency that can be exploited in a trading strategy. In this case, the inefficiency is the CHF price ceiling that was established by the Swiss National Bank in September 2011. Since then the EUR can't drop below 1.20 CHF anymore, as the Swiss will massively interfere when it comes close to that border. They do that for protecting their export and tourism industry. The ceiling also restricts price movements in the opposite direction. Therefore the narrow distribution.
We can see that the price movements are limited between 1.20 and 1.26. This effect can be used for a simple low-risk trading system. The system has 4 rules for entry, filtering, exit, and trade volume: 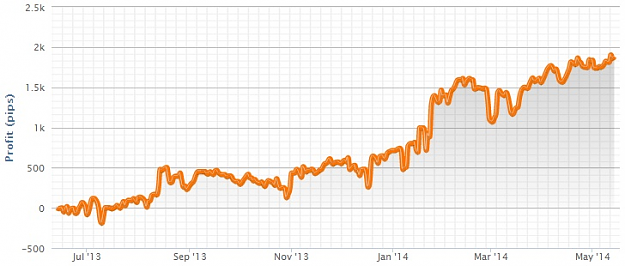
As long as the price ceiling is in place, the system bears almost no risk. Of course the risk begins when the Swiss governement suddenly decides to give up their EUR/CHF ceiling. If that ever happened, it would be most likely in a scenario with a high EUR rate, which means that many short trades are open. You must then decide to close them or keep them open. If the EUR/CHF rate drops, the system automatically closes the trades with profit. If it rises, you need to close them manually at some point with a loss. That's the risk of the system and you must be aware it when you trade it. The EA has a switch for opening only long trades. This eliminates this risk, but of course also reduces the profit.
For automated trading this system, you'll need either an FXCM account and the Zorro platform, or MetaTrader4 and the Zorro EA. Zorro can be downloaded here: http://zorro-trader.com/download.php. Install the Zorro.mq4 EA in your MT4 Experts folder and select "Z4" or "Z5" in the Zorro window. Z4 is the version for small budgets that enters less trades. Depending on the EUR/CHF volatility, the system opens up to 5 trades per week. There can be also weeks with no trade when there is little price movement.
The download also contains a detailed description of the setup. Feel free to ask here if you have questions about that system.
Ok, that was the advertisement. Now I'm going to describe the rules of the 100% system and the theory behind it. You can code it yourself, or run it manually as the rules are rather simple, or follow it on Zulu, or you can download it from the link below. The system has been backtested with 3 years data and so far traded live for 1 year.
At first glance, 100% win rate seems suspicious. If such a system existed, why isn't anyone trading it? In fact it's not very difficult to develop a system that produces 100% win rate for some time. But such methods are normally high risk and thus rely on trader's luck. Problem with luck is that you never know when you run out of it. The algorithm presented here however bears low risk and does not rely on luck. It also uses no indicators or "technical analysis" stuff. Still, it generates 200% annual return in live trading so far, and can be traded with very low capital, such as $ 200. So, it's not the holy grail, but it's a pretty good system.
A little theory. We're not looking here into some little nooks and crannies of a price curve, but into the market as a whole. All rational trade systems exploit market inefficiencies. Unfortunately most such inefficiencies are shortlived, that's why a system can work well one year and produce huge losses in the next year. However there are also some long term market inefficiencies that allow stable and solid systems. A very interesting inefficiency is visible in the chart below:
Attached Image (click to enlarge)
This is a price distribution chart, it shows the frequency of prices during a certain time period. The red bars are based on the EUR prices in Swiss Francs (EUR/CHF) since October 2011. For comparison, the green bars are the EUR prices in US Dollars (EUR/USD) in the same time period.
It is clear to see that the red EUR/CHF price distribution is narrow and not bell shaped, i.e. non-Gaussian. Prices appear to oscillate between two levels. In comparison, the green EUR/USD distribution is wide and approximately Gaussian. A non-Gaussian price distribution is often the indicator of a market inefficiency that can be exploited in a trading strategy. In this case, the inefficiency is the CHF price ceiling that was established by the Swiss National Bank in September 2011. Since then the EUR can't drop below 1.20 CHF anymore, as the Swiss will massively interfere when it comes close to that border. They do that for protecting their export and tourism industry. The ceiling also restricts price movements in the opposite direction. Therefore the narrow distribution.
We can see that the price movements are limited between 1.20 and 1.26. This effect can be used for a simple low-risk trading system. The system has 4 rules for entry, filtering, exit, and trade volume:
- Divide the 1.20..1.26 price range into equal segments of about 15 pips. Whenever the price enters such a segment, open simultaneously a long and a short trade.
- Don't open a trade when that segment already has an open trade in the same direction, or when more than 20 trades are open. Also don't open when the segment is in the unfavorable half of the price range - the upper half for long and the lower half for short trades - and was not crossed by the price curve in the last 120 hours.
- When the price leaves a segment with an open winning trade, close the trade and take the profit.
- Set the trade volume in proportion to the frequency of its entry price, i.e. the height of the price bar in the price distribution chart above.
This is has some similarity to a grid trading system. However, grid systems are normally high risk, but this is not the case here due to the limited price range. Note that the method works only with currency pairs that have a price floor or ceiling, such as EUR/CHF. Here are the results from a 3-year backtest from 2011..2014:
- ~200% annual return
- 98% win rate (not 100% because the test closes all open trades at the end)
- Sharpe Ratio ~2.0
This is the profit curve from 1 year live trading on a Zulu signal account:
Attached Image (click to enlarge)
As long as the price ceiling is in place, the system bears almost no risk. Of course the risk begins when the Swiss governement suddenly decides to give up their EUR/CHF ceiling. If that ever happened, it would be most likely in a scenario with a high EUR rate, which means that many short trades are open. You must then decide to close them or keep them open. If the EUR/CHF rate drops, the system automatically closes the trades with profit. If it rises, you need to close them manually at some point with a loss. That's the risk of the system and you must be aware it when you trade it. The EA has a switch for opening only long trades. This eliminates this risk, but of course also reduces the profit.
For automated trading this system, you'll need either an FXCM account and the Zorro platform, or MetaTrader4 and the Zorro EA. Zorro can be downloaded here: http://zorro-trader.com/download.php. Install the Zorro.mq4 EA in your MT4 Experts folder and select "Z4" or "Z5" in the Zorro window. Z4 is the version for small budgets that enters less trades. Depending on the EUR/CHF volatility, the system opens up to 5 trades per week. There can be also weeks with no trade when there is little price movement.
The download also contains a detailed description of the setup. Feel free to ask here if you have questions about that system.