If you're using Dean Malone's original settings, the green line is a SMA(2) of a RSI(13,close). Then the red line is a SMA(7) of the green line.
By way of proof, you can replicate this using factory MT4 indys:
1. Create RSI in a new window. Set the parameters to 13 and close, and the color to None, so that it doesn't show.
2. Drag the MA indy into the same window as the RSI. Set the values to 2, simple, close, color = Green, and most importantly, Apply to = Previous Indicator's Data
3. Drag the MA indy into the same window as the RSI. Set the values to 7, simple, close, color = Red, and once again, Apply to = Previous Indicator's Data
That should be an exact match to TDI with the settings (see attached screenshot): RSI_Period = 13 RSI_Price = 0 RSI_Price_Line = 2 RSI_Price_Type = 0 Trade_Signal_Line = 7 Trade_Signal_Type = 0
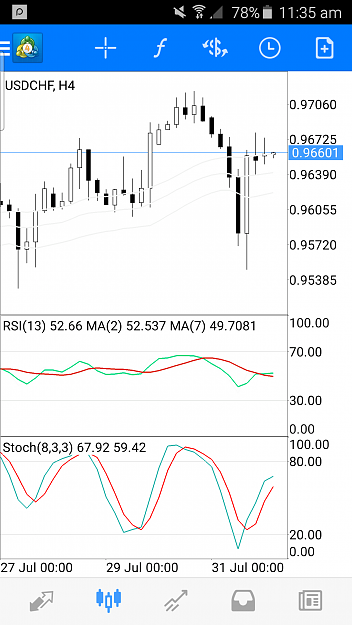
Here is a screenshot of the TDI on my Android MT4:
Attached Image (click to enlarge)
Attached File(s)
1