►►BioSTOCKS OUTLET & BACCALA' EMPORIUM◀◀
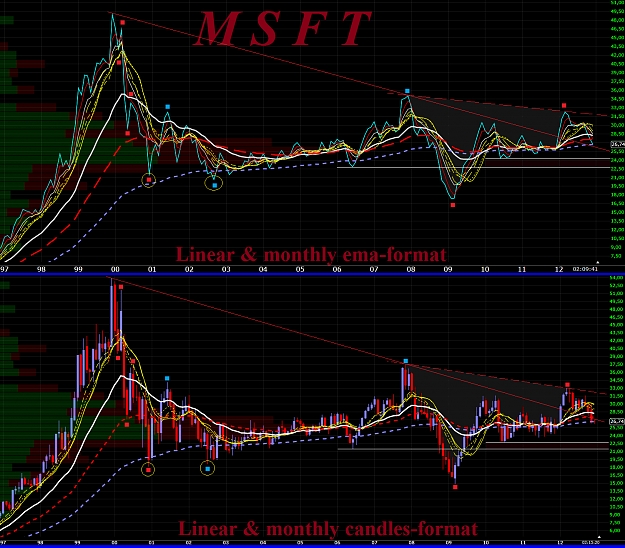
Some notes/charts about M S F T.
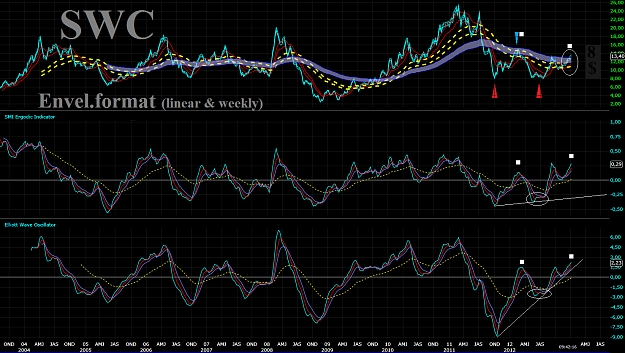
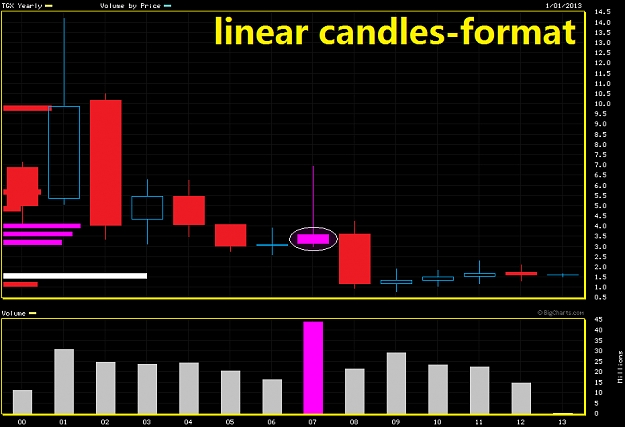
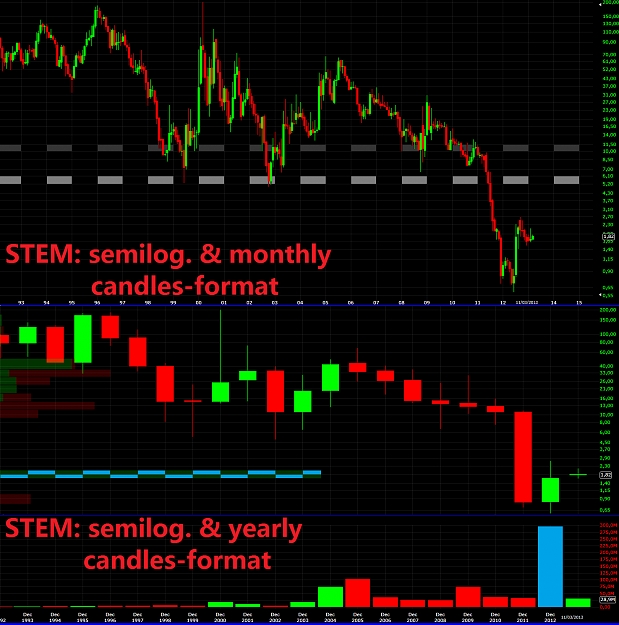
Wave counts (theoretical) on M.S.F.T.:
'A' - 1999-2000 (red square-markers);
'B' - 2000-2007 (blue square-markers);
'C' - 2007 in-progress ???
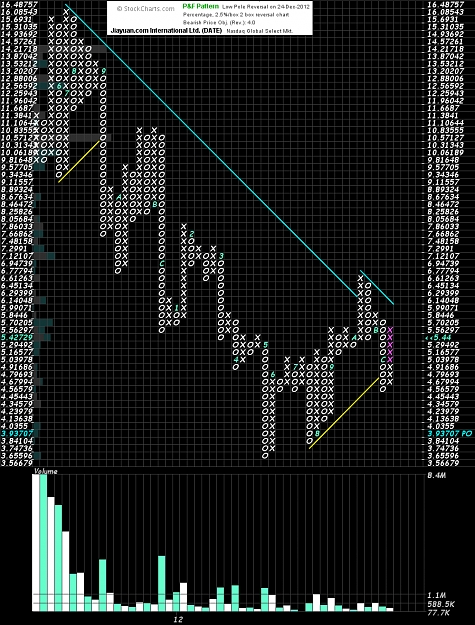
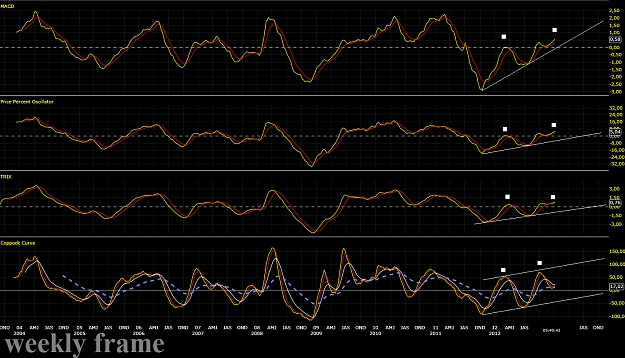
Key-price elements:
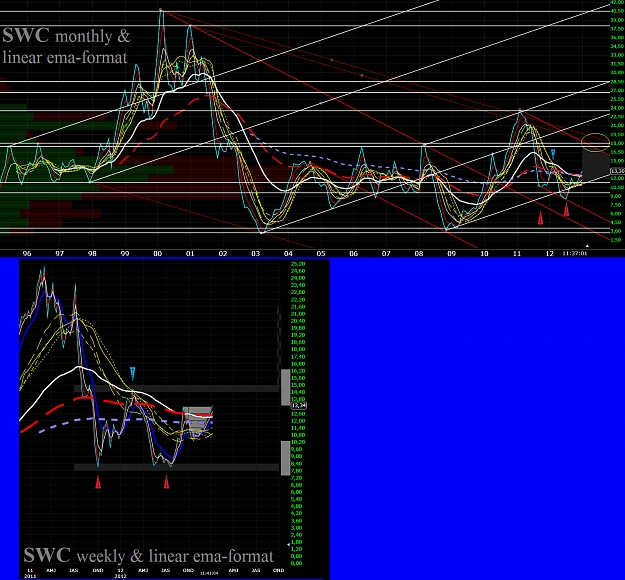
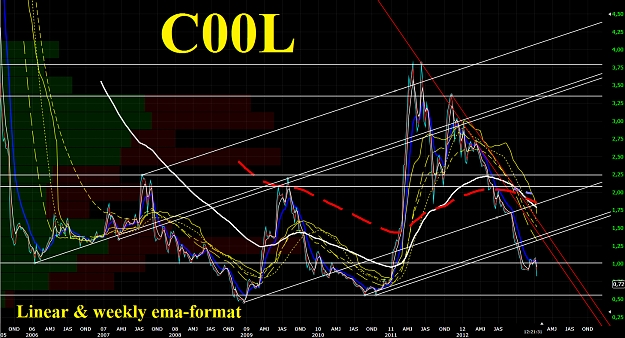
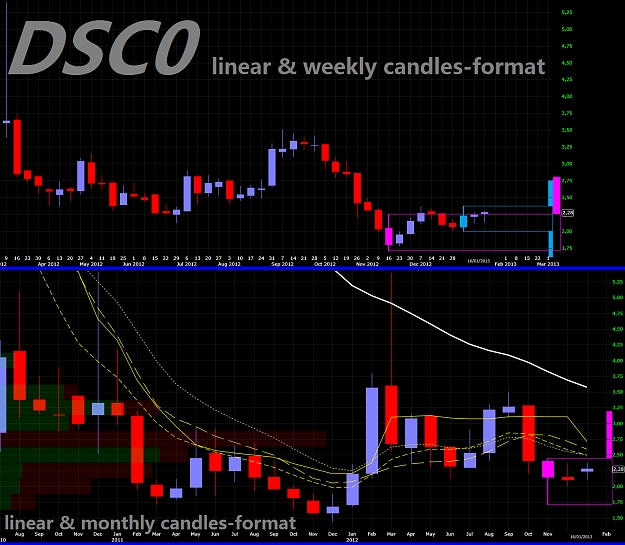
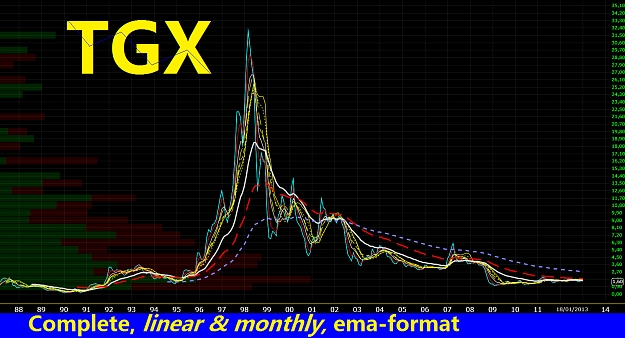
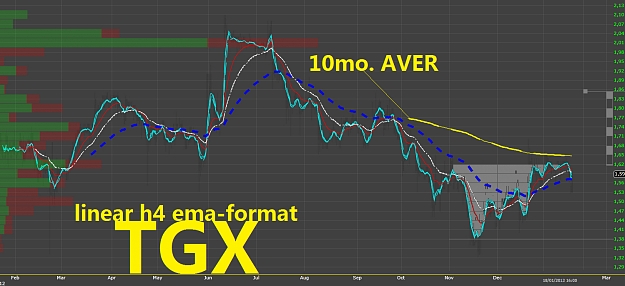
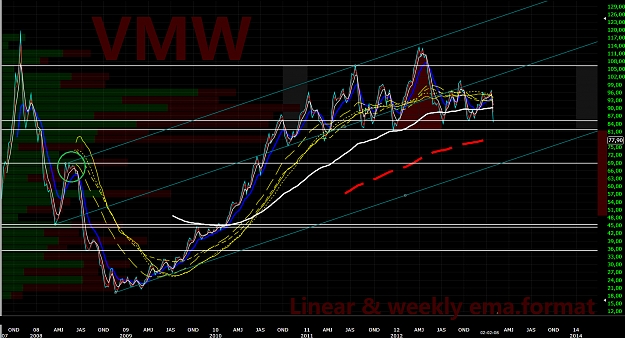
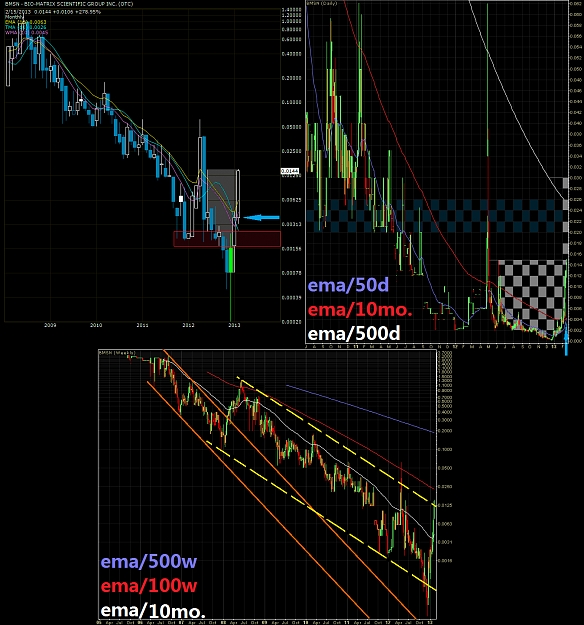
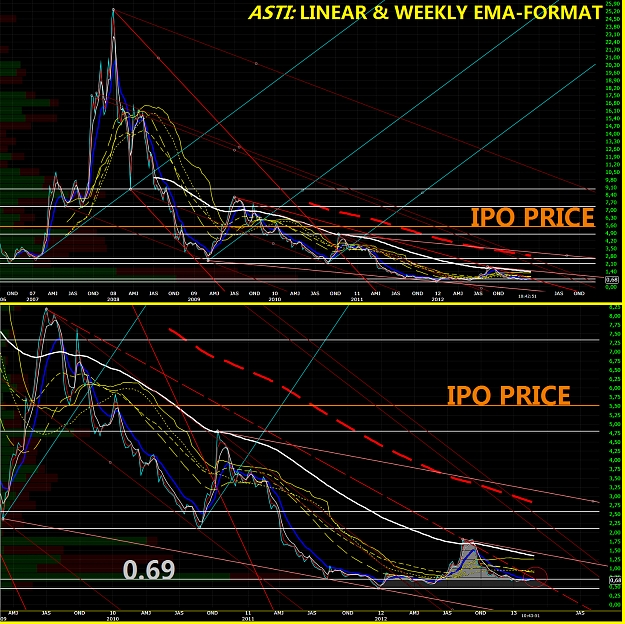
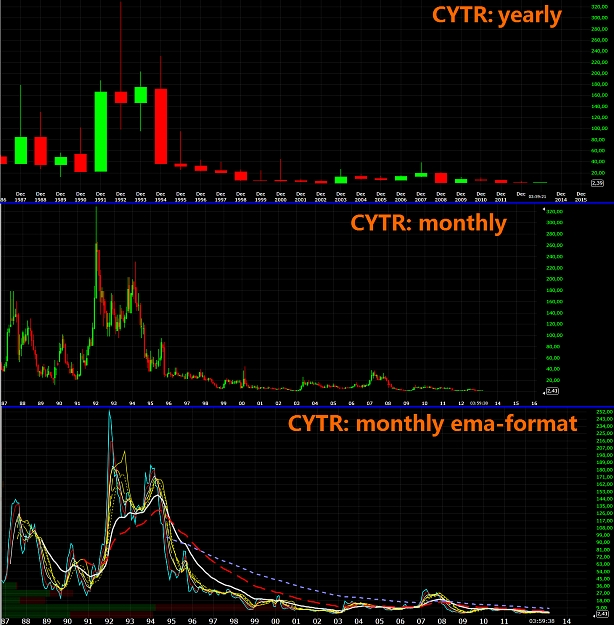
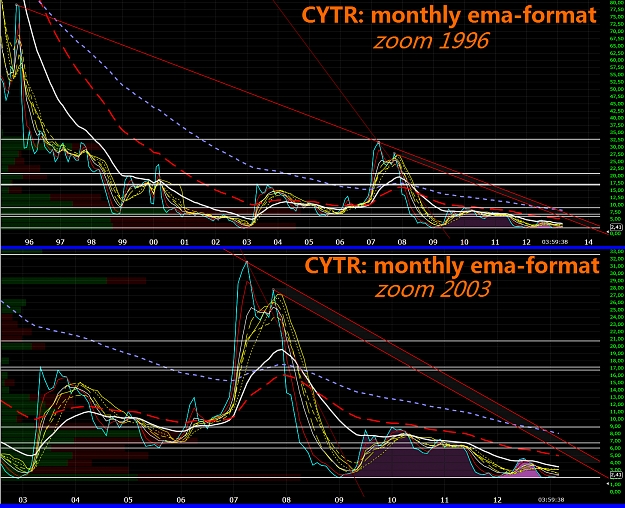
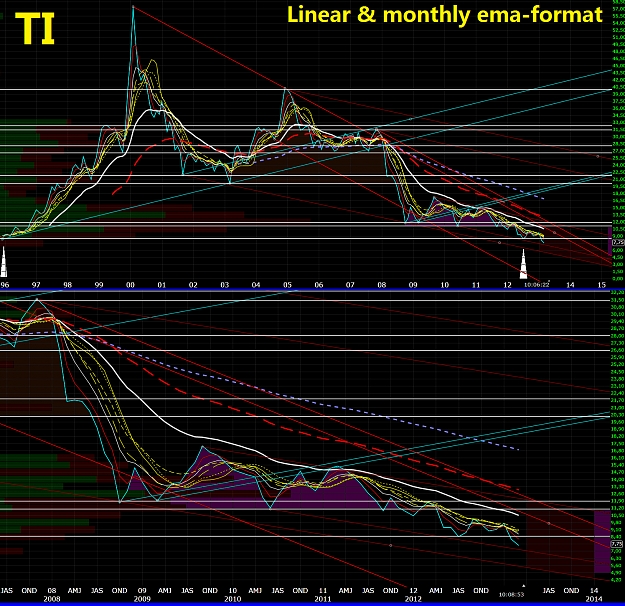
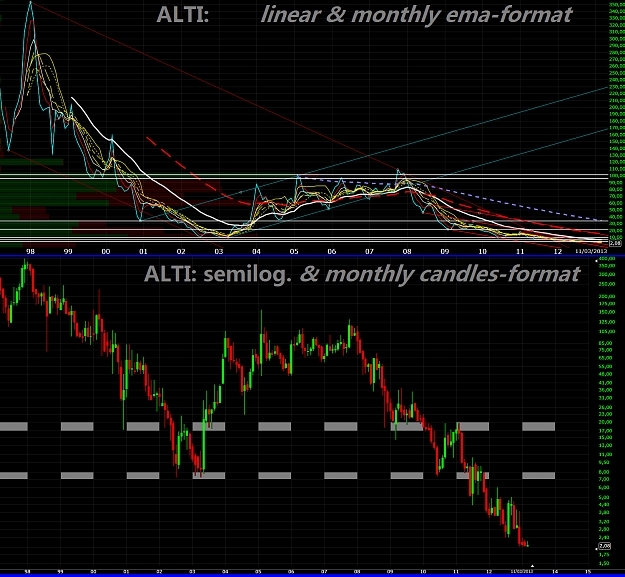
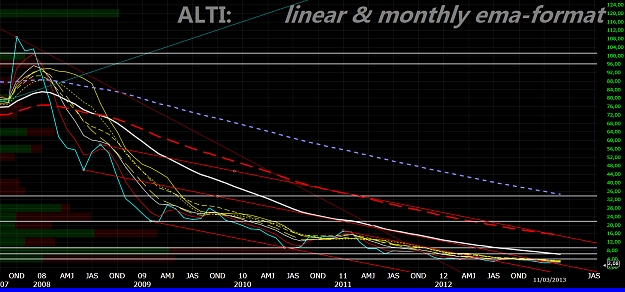
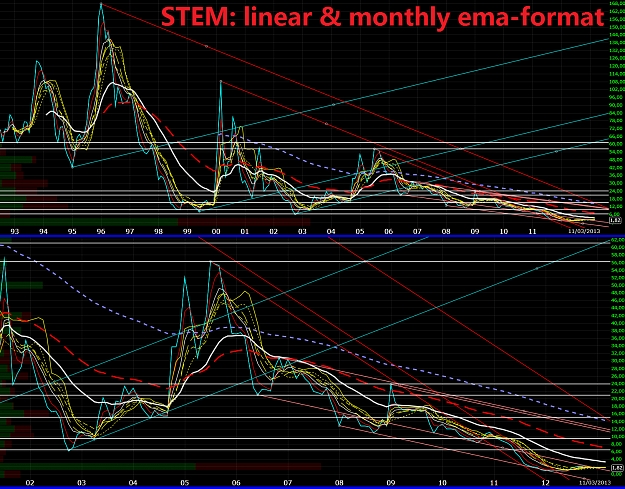
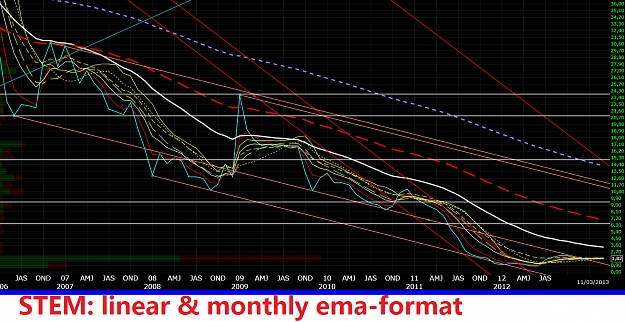
1) Quadruple 10mo. average vs. actual price (sma, ema, fwma, vwma);
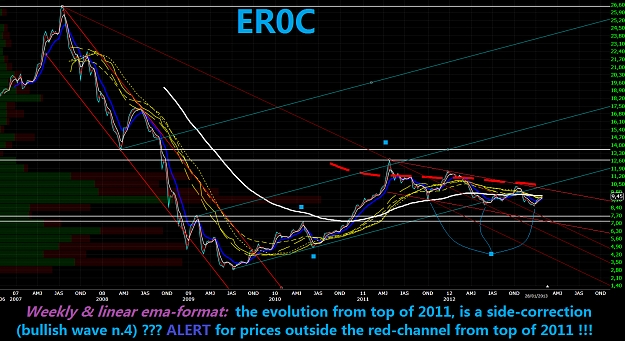
2) main descending line from top of 1999 (red-continuous);
3) linking line between top-2007 vs. top-2012 (red-dotted);
4) top 2012;
5) lows of 2006 & 2010;
6) lows of 2000 & 2001.
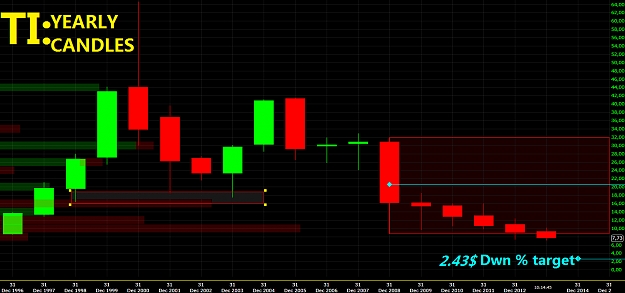
Actual price-structure shows an important sign of bear evolution (see actual prices vs. 10mo. averages).
Prices well below 5 increase the probability of 'C' extension, with a first step toward 6, and a second step toward an important SellOff.
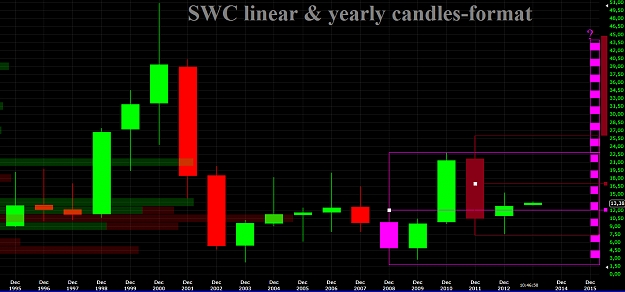
Only with prices well above 4 there will be the stop of 'C' evolution and a possible reversal of structure in bullish-status (see giant gray-cup 2007-2012) !!!
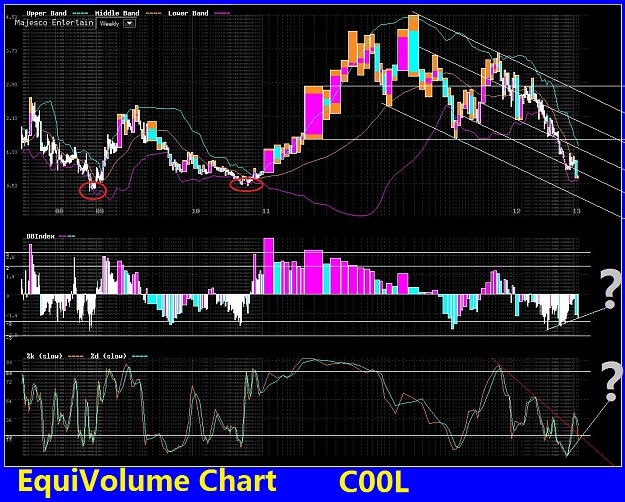
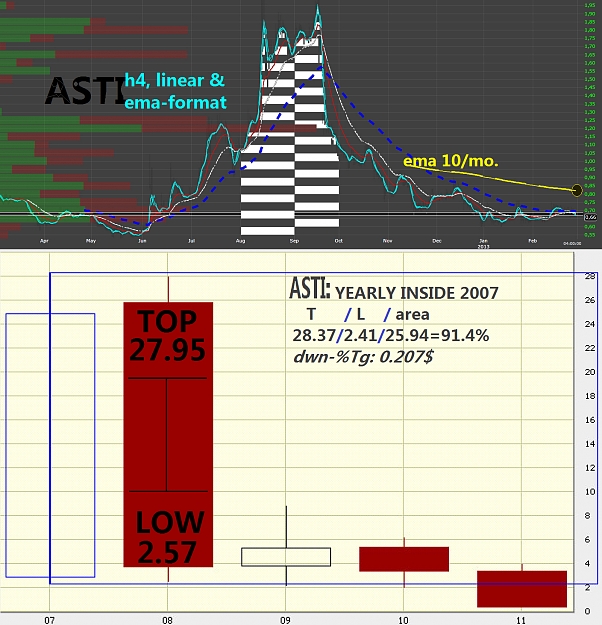
According to priceXvolume levels, area 27-24$ is megalithic.
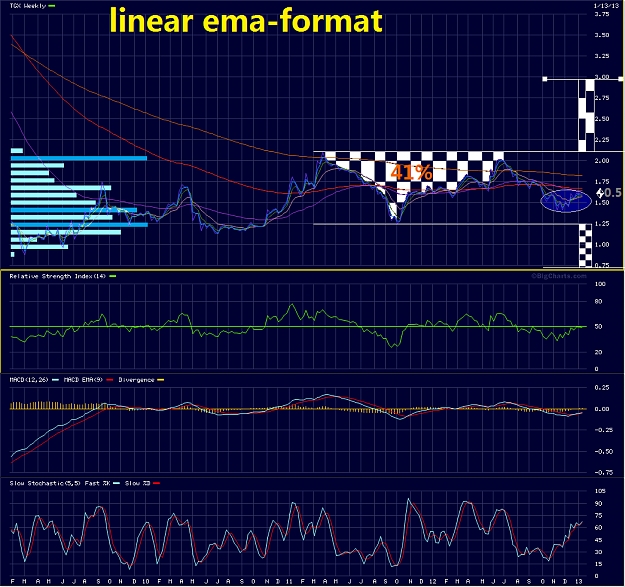
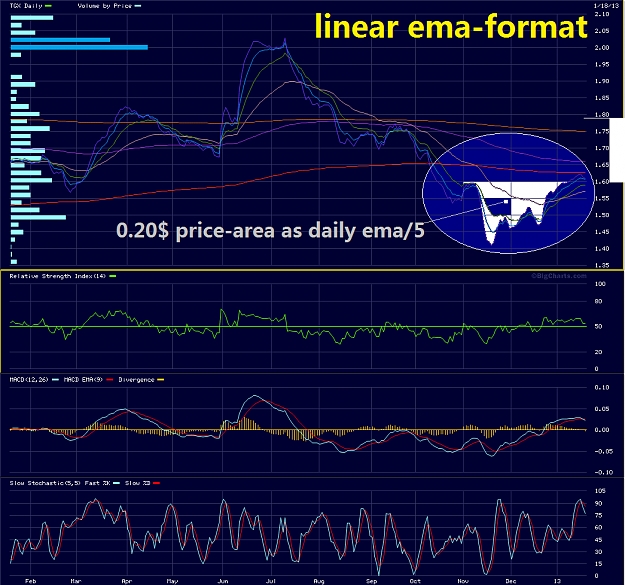
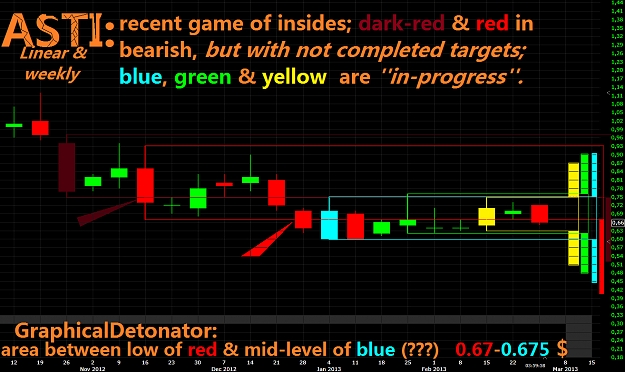
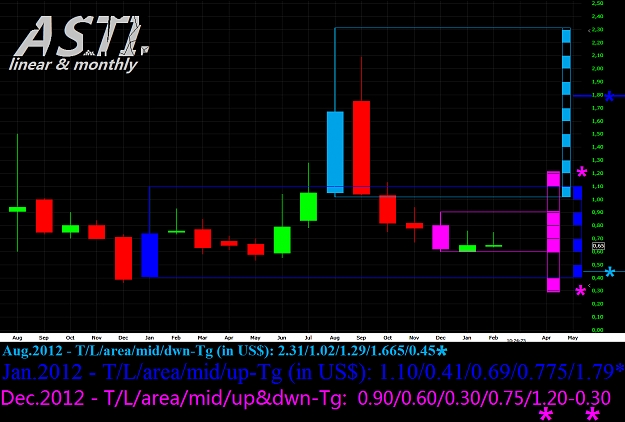
Charts: January Rule -- December Rule -- Weekly ema-format -- Monthly ema-format.
Source: FreeStockChart.
Sorry for my bad English. I hope that this post is at least minimally useful.
☻/♪ ❖ Earth.pk, Alert 2.O !!! ❖
/▌
/|
Tuned on main trend, but follows short-medium term signs from underlying prices, for a correct & real-time set-up.
It is very important do not anticipate the main trend of the underlying financial instruments.
Ⓘℳ☢ ℬɣ $@❣♆¥ ►►♥ █║▌│││█║℠
 ║▌║▌▌║█
 ❤◀◀
❤◀◀
₭€$AⅅⅅhAPhA'pe'₭AℳℙA' ℬunda-ℬunda €MP¥R€ ❣❣❣
http://www.bloomberg.com/apps/chart?...T%3AUS&img=pnghttp://www.bloomberg.com/apps/chart?...T%3AUS&img=png
Some notes/charts about M S F T.
Wave counts (theoretical) on M.S.F.T.:
'A' - 1999-2000 (red square-markers);
'B' - 2000-2007 (blue square-markers);
'C' - 2007 in-progress ???
Key-price elements:
1) Quadruple 10mo. average vs. actual price (sma, ema, fwma, vwma);
2) main descending line from top of 1999 (red-continuous);
3) linking line between top-2007 vs. top-2012 (red-dotted);
4) top 2012;
5) lows of 2006 & 2010;
6) lows of 2000 & 2001.
Actual price-structure shows an important sign of bear evolution (see actual prices vs. 10mo. averages).
Prices well below 5 increase the probability of 'C' extension, with a first step toward 6, and a second step toward an important SellOff.
Only with prices well above 4 there will be the stop of 'C' evolution and a possible reversal of structure in bullish-status (see giant gray-cup 2007-2012) !!!
According to priceXvolume levels, area 27-24$ is megalithic.
Charts: January Rule -- December Rule -- Weekly ema-format -- Monthly ema-format.
Source: FreeStockChart.
Sorry for my bad English. I hope that this post is at least minimally useful.
☻/♪ ❖ Earth.pk, Alert 2.O !!! ❖
/▌
/|
Tuned on main trend, but follows short-medium term signs from underlying prices, for a correct & real-time set-up.
It is very important do not anticipate the main trend of the underlying financial instruments.
Ⓘℳ☢ ℬɣ $@❣♆¥ ►►♥
₭€$AⅅⅅhAPhA'pe'₭AℳℙA' ℬunda-ℬunda €MP¥R€ ❣❣❣
http://www.bloomberg.com/apps/chart?...T%3AUS&img=pnghttp://www.bloomberg.com/apps/chart?...T%3AUS&img=png
Attached Image (click to enlarge)