Greetings earthlings  !
!
I would really appreciate if someone had the time to help me out and make an indicator for me. The main idea is this:
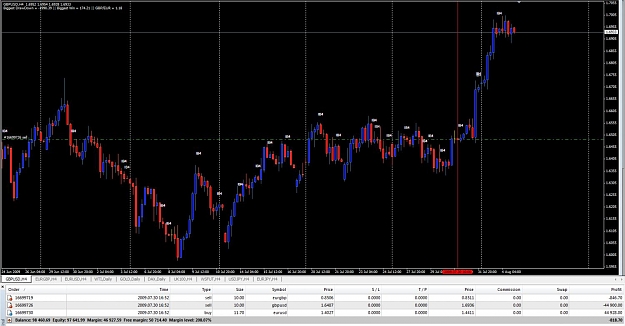
I would like to test if there's a difference between a trade on a cross-pair and two trades that are USD neutral and thus becomes like the cross-pair trade. Look at the attached chart: Selling 10 lots of EURGBP should be the invert of selling 10 lots of GBPUSD and buying 11.7 lots of EURUSD. To make the two trades USD neutral, the lotssize ratio on EURUSD:GBPUSD should be equal to (1/EURGBP):1. For example, at the time of openning the trades in the bottom of the attached picture, EURGBP's price was at 0.8506. This gives the following lotssizes:
EURGBP: Short 1 lot
GBPUSD: Short 1 lot
EURUSD: Long 1/0.8506 = 1.18 lot (I now the picture says 1.17 but thats an error on my part)
I would like the indicator to have an external input of how many bars back (from the current bar) for which to set the actual profit to zero by opening all the trades regardless of timeframe, or if possible an external input for time (hour/min) and date (year/month/day). Of course the profit at the start of the chosen bar (or time and date) should be negative due to the spreads. I'm not looking for it to open the trades, I would only like it to show the profit/loss as a histogram above/below 0 in terms of pips. As direction doesn't matter, the indicator could open the trades in the direction described above: that is short EG, short GU and long EU with the lotssize as described.
I hope that I've made myself clear enough for someone that is willing to help me out. As you can see I have an indicator in the top-left corner in the picture which shows largest drawdown and win, and the current GBP/EUR ratio, from this I have noticed earlier that the biggest drawdown at one point was -25pips and the biggest win was around +20 pips. The reason I want the new indicator is to see how the acutal loss and profit goes back and forth and to see if the direction has anything to do with the direction of either of the involved currencypairs, wihch is why I want to be able to place the indicator on any of the 3 charts and show the same thing. I would like to now if there's a winning hedge, as this is the true hedge since I'm long EURGBP with the sum of the two trades of EU and GU, and short on the short EURGBP for equal lotssizes.
One last thing: If it's difficult to calculate the +/- pips due to the uneven lotssize of EU, maybe making the lotssize something like the ratio of 100:117.54 (or more) could give a more precise profit/loss calculation. If you have any questions, please let me know. I'll give it a try on the weekend to make an indicator, but I fear that it will take too long time, which is why I have come here and asked for your help.
I would really appreciate if someone had the time to help me out and make an indicator for me. The main idea is this:
I would like to test if there's a difference between a trade on a cross-pair and two trades that are USD neutral and thus becomes like the cross-pair trade. Look at the attached chart: Selling 10 lots of EURGBP should be the invert of selling 10 lots of GBPUSD and buying 11.7 lots of EURUSD. To make the two trades USD neutral, the lotssize ratio on EURUSD:GBPUSD should be equal to (1/EURGBP):1. For example, at the time of openning the trades in the bottom of the attached picture, EURGBP's price was at 0.8506. This gives the following lotssizes:
EURGBP: Short 1 lot
GBPUSD: Short 1 lot
EURUSD: Long 1/0.8506 = 1.18 lot (I now the picture says 1.17 but thats an error on my part)
I would like the indicator to have an external input of how many bars back (from the current bar) for which to set the actual profit to zero by opening all the trades regardless of timeframe, or if possible an external input for time (hour/min) and date (year/month/day). Of course the profit at the start of the chosen bar (or time and date) should be negative due to the spreads. I'm not looking for it to open the trades, I would only like it to show the profit/loss as a histogram above/below 0 in terms of pips. As direction doesn't matter, the indicator could open the trades in the direction described above: that is short EG, short GU and long EU with the lotssize as described.
I hope that I've made myself clear enough for someone that is willing to help me out. As you can see I have an indicator in the top-left corner in the picture which shows largest drawdown and win, and the current GBP/EUR ratio, from this I have noticed earlier that the biggest drawdown at one point was -25pips and the biggest win was around +20 pips. The reason I want the new indicator is to see how the acutal loss and profit goes back and forth and to see if the direction has anything to do with the direction of either of the involved currencypairs, wihch is why I want to be able to place the indicator on any of the 3 charts and show the same thing. I would like to now if there's a winning hedge, as this is the true hedge since I'm long EURGBP with the sum of the two trades of EU and GU, and short on the short EURGBP for equal lotssizes.
One last thing: If it's difficult to calculate the +/- pips due to the uneven lotssize of EU, maybe making the lotssize something like the ratio of 100:117.54 (or more) could give a more precise profit/loss calculation. If you have any questions, please let me know. I'll give it a try on the weekend to make an indicator, but I fear that it will take too long time, which is why I have come here and asked for your help.
Attached Image (click to enlarge)