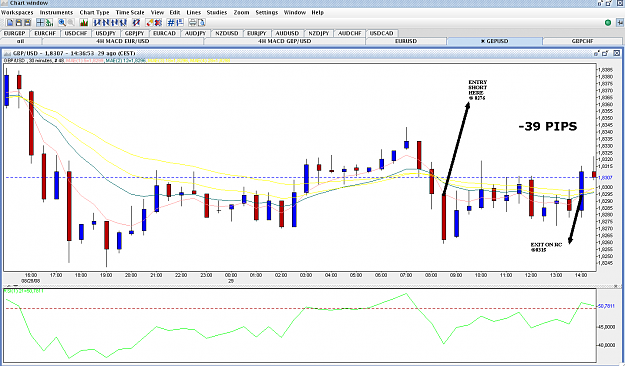
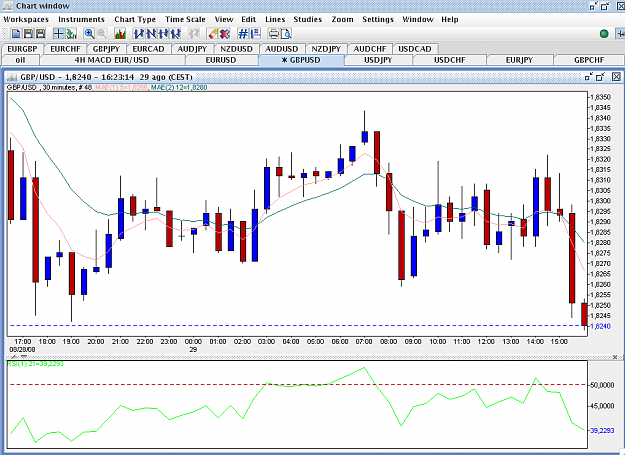
DislikedHi Eraserhead, think your chart is actually the hourly. It looks as though the small bar (prior to the longer down bar that you have used as the signal bar) might have been a 5/12 cross and as RSI was below 50 you could have entered then. Let us know.
Aarangio, thanks. Good to see you on here, hope you're well. have you been looking at oil lately?? Still as scary as ever!
rgds, strada.Ignored
Thank a milion for the charts, they are shining like gold.
Am I reading well, are you trading with 1minute TF???
Can you please make some example on Stop Losses as well?
thanks again