Easy BB Gann System for mechanical traders here: http://www.forexfactory.com/showthre...49#post7771149
Hard but probably more profitable BB Gann System for discretionary traders below:
=========================================================================================================
Hey Fellow Pipmakers!
I first introduced the BB Gann system in Eitan's 'The Science MRI System' thread in this post:
http://www.forexfactory.com/showthre...28#post7759828
Quite a lot of what follows is rehashed from that original post.
I strongly suggest you take a look at Eitan's SMRI System, it's mechanical and quite profitable:
http://www.forexfactory.com/showthread.php?t=503148
The BB Gann System came about as an accident almost. I was checking out a few of Eitan's older systems, when I noticed something interesting about the Stochastic 8,1,1 he was using in his MTS system: it appeared that whenever there was a quick, straight move from the BUY to the SELL area (or vice versa), price seemed to go some distance toward that direction afterwards.
Of course taking trades blindly based only on this fact didn't lead to very great results. So I tried to combine it with some of the SMRI indicators and some other ideas that I had in my trading kit (I've made approximately some 50 systems in my time as a trader, but none were anything to write home about!)
I'm also not a very big fan of discretionary systems, so I tried to make mine as mechanical as possible, with clear entries, TP and SL. Unfortunately, I haven't succeeded in doing this to my satisfaction: the system is still more discretionary/subjective than I would like.
Note that this system, though its foundations are laid already, is still a work in progress. We're still backtesting on several pairs and trying to come up with the best rules for trading them (not doing curve-fitting, mind you!)
I will keep this first post updated with the latest rules.
For now the rules are as follows:
------------------------------------------------------------------------------------------------------------------------------------------------------------------------------------------------------------
SELL RULES:
1] Stochastic has gone from Buy region to Sell region, i.e. from 75 level to 25 level, even better if it's gone from 85 to 15. The cleaner/straighter/nicer/faster/less zigzaggy the move the better.
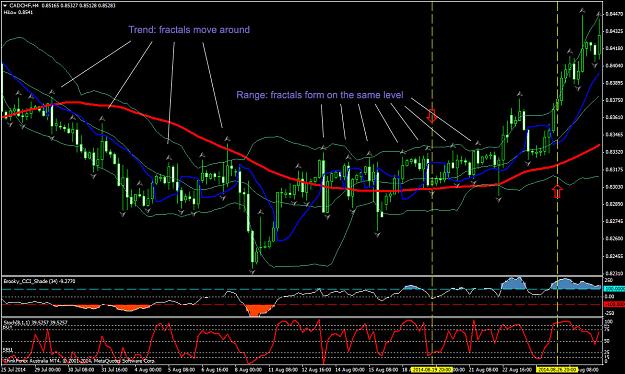
2a] CCI 34 has gone from overbought to normal levels (i.e. has crossed upper 100 level downwards) AND there's a valley before the last peak (examples of valleys and peaks are shown in the pic at the end of the post)
OR
2b] CCI 34 has gone from normal levels to oversold (i.e. has crossed lower 100 level downwards) AND there's a valley before the last valley (possibly indicating a lasting downtrend) (when I say 'before the last valley' I mean before the valley currently being formed)
Note: When setups agree with rule 2b, it's usually because there's a strong downtrend, which means that price will probably cling to the lower band, which will violate rule 3 below. It's good in such cases to wait for price to retrace a little bit before entering. It's also good for price not to be far from MA. If price is too far from MA, that may indicate exhaustion of the trend, and an imminent reversal, at least toward MA resistance.
3] Price action (henceforth PA) has crossed middle Bollinger Band (henceforth BB) downwards or is near it (or, if everything else is looking well, at least there's some room between current price and lower extreme BB, though this latter rule may be violated when BBs are too narrow because a breakout is about to occur, commonly referred to as the Bollinger squeeze)
4] PA hasn't breached or punctured the lower extreme BB (again, this rule may be violated in case of Bollinger squeezes, or when everything else is looking really nice!)
5] Gann HiLo indicator's blue line is currently above the PA
Red Moving Average 60 (henceforth MA) plays no super significant role, other than 1) to help the trader identify the current trend (when there are consecutive CCI valleys, when Stoch tends to zigzag around the Sell area, when Gann HiLo is below the red MA, and when PA is below the red MA, then we're most probably in a downtrend), 2) to set possible TP & SL and 3) to indicate possible support and resistance areas.
SELL SL & TP:
Fractals Method (or Method 1): Last Fractal high is the SL and TP is identical: so if last Fractal high is 50 pips, TP is also 50 pips.
BB Method (or Method 2): Higher extreme BB is the SL. Lower extreme BB is the TP.
Fractals&BB Method (or Method 3): Last Fractal high is the SL and lower extreme BB is TP. This usually leads to a negative Risk Reward (RR) ratio.
BB&Fractals Method (or Method 4): Higher extreme BB is SL and last Fractal high determines TP. This is usually a positive RR ratio.
MA Method (or Method 5): SL is either last Fractal high or higher extreme BB, but TP is MA, because it may act as a resistance/support. This option might be preferable in cases when PA has been rejected by the MA in the recent past.
Good thing about placing your TP and SL according to the BBs is that they adjust to the market: as the BBs move -- maybe they become tighter, maybe they become wider -- you move your TP accordingly, tightening it or widening it respectively. It is recommended that you keep your original SL untouched, but that you move your TP according to the BBs. That way, if we picked the wrong direction, we can get out with a small profit or break even (BE).
Below is a pic of an ideal Sell Trade according to rule 2a:
BUY RULES - Reverse of the above:
1] Stochastic has gone from Sell region to Buy region, i.e. from 25 level to 75 level, even better if it's gone from 15 to 85. The cleaner/straighter/nicer/faster/less zigzaggy the move the better.
2a] CCI 34 has gone from oversold to normal levels (i.e. has crossed lower 100 level upwards) AND there's a peak before the last valley
OR
2b] CCI 34 has gone from normal levels to overbought (i.e. has crossed upper 100 level upwards) AND there's a peak before the last peak (possibly indicating a continued uptrend) (when I say 'before the last peak' I mean before the peak currently being formed)
Note: When setups agree with rule 2b, it's usually because there's a strong uptrend, which means that price will probably cling to the upper band, which will violate rule 3 below. It's good in such cases to wait for price to retrace a little bit before entering. It's also good for price not to be far from MA. If price is too far from MA, that may indicate exhaustion of the trend, and an imminent reversal, at least toward MA support.
3] PA has crossed middle BB upwards or is near it (or, if everything else is looking well, at least there's some room between current price and higher extreme BB, though this latter rule may be violated when BBs are too narrow because a breakout is about to occur, commonly referred to as the Bollinger squeeze)
4] PA hasn't breached or punctured the higher extreme BB (again, this rule may be violated in case of Bollinger squeezes)
5] Gann HiLo indicator's blue line is currently below the PA
MA plays no super significant role, other than 1) to help the trader identify the current trend (when there are consecutive peaks, when Stoch tends to zigzag around the Buy area, when Gann HiLo is above the red MA, and when PA is above the red MA, then we're most probably in an uptrend), 2) to set possible TP & SL and 3) to indicate possible support and resistance areas.
BUY SL & TP:
Fractals Method (or Method 1): Last Fractal low is the SL and TP is identical: so if last Fractal low is 50 pips, TP is also 50 pips.
BB Method (or Method 2): Lower extreme BB is the SL. Higher extreme BB is the TP.
Fractals&BB Method (or Method 3): Last Fractal low is the SL and higher extreme BB is TP. This usually leads to a negative RR ratio.
BB&Fractals Method (or Method 4): Lower extreme BB is SL and last Fractal low determines TP. This is usually a positive RR ratio.
MA Method (or Method 5): SL is either last Fractal low or lower extreme BB, but TP is MA, because it may act as a support. This option might be preferable in cases when PA has been rejected by the MA in the recent past.
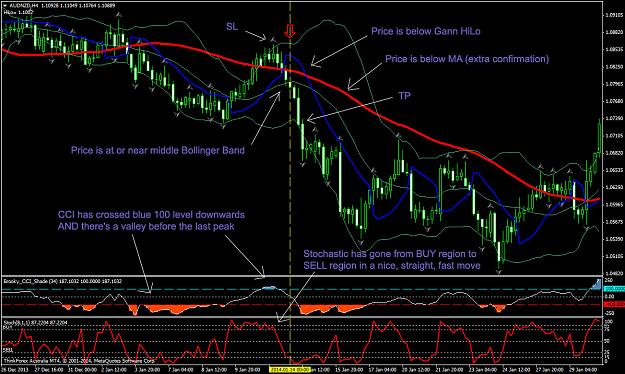
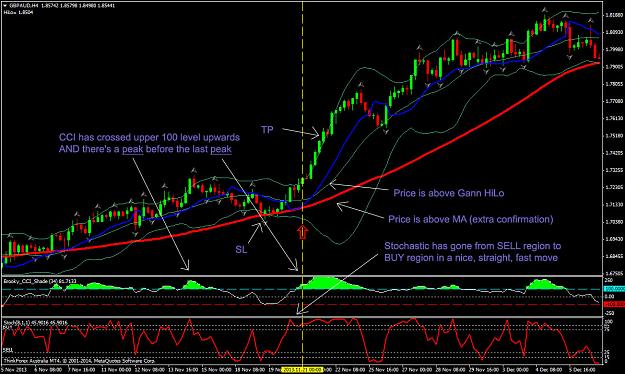
Below is an (almost) ideal pic of a Buy Trade according to rule 2b:
------------------------------------------------------------------------------------------------------------------------------------------------------------------------------------------------------------
These are the essential rules of the BB Gann System, but it is highly recommended that you go through our backtests (BT) (I will post soon), mentally taking every trade one by one, reading the explanations for each trade, to familiarize yourself with this method and become as proficient as possible at trading it.
Though this system was developed on and for the H4 chart, some casual/visual BT shows it might be profitable on all timeframes, even down to the M5. But this is as yet unsubstantiated.
So far the system seems to work best on GBP pairs, as well as volatile pairs like EURAUD.
Lastly, I would like to thank (in no particular order!) the people who have either worked on this system itself or who have supported me in other ways, or just people I know! :
Soros (my positive thinking instructor), Arso (who has done more BT for this system than anyone else, myself included!), Eitan (without whom this system probably wouldn't exist), RockRobb, Sriniff (an awesome programmer), flyer415, reso09, nickcnew, Ata-Turkoglu, priceaction7, spufuz, ginger, pips777, carlosar13, BobMorane, pending, Vigovski, Cariddi, Adam84, Blackeagle, RockerZeus (who modified the CCI indicator we are using), and, just, everyone!!
Oh and here's the template for this system! (I renew whenever possible. You know it's new when it has close to 0 downloads!) :
Indicators you might be missing:
The rest are included in MT4.
Hard but probably more profitable BB Gann System for discretionary traders below:
=========================================================================================================
Hey Fellow Pipmakers!
I first introduced the BB Gann system in Eitan's 'The Science MRI System' thread in this post:
http://www.forexfactory.com/showthre...28#post7759828
Quite a lot of what follows is rehashed from that original post.
I strongly suggest you take a look at Eitan's SMRI System, it's mechanical and quite profitable:
http://www.forexfactory.com/showthread.php?t=503148
The BB Gann System came about as an accident almost. I was checking out a few of Eitan's older systems, when I noticed something interesting about the Stochastic 8,1,1 he was using in his MTS system: it appeared that whenever there was a quick, straight move from the BUY to the SELL area (or vice versa), price seemed to go some distance toward that direction afterwards.
Of course taking trades blindly based only on this fact didn't lead to very great results. So I tried to combine it with some of the SMRI indicators and some other ideas that I had in my trading kit (I've made approximately some 50 systems in my time as a trader, but none were anything to write home about!)
I'm also not a very big fan of discretionary systems, so I tried to make mine as mechanical as possible, with clear entries, TP and SL. Unfortunately, I haven't succeeded in doing this to my satisfaction: the system is still more discretionary/subjective than I would like.
Note that this system, though its foundations are laid already, is still a work in progress. We're still backtesting on several pairs and trying to come up with the best rules for trading them (not doing curve-fitting, mind you!)
I will keep this first post updated with the latest rules.
For now the rules are as follows:
------------------------------------------------------------------------------------------------------------------------------------------------------------------------------------------------------------
SELL RULES:
1] Stochastic has gone from Buy region to Sell region, i.e. from 75 level to 25 level, even better if it's gone from 85 to 15. The cleaner/straighter/nicer/faster/less zigzaggy the move the better.
2a] CCI 34 has gone from overbought to normal levels (i.e. has crossed upper 100 level downwards) AND there's a valley before the last peak (examples of valleys and peaks are shown in the pic at the end of the post)
OR
2b] CCI 34 has gone from normal levels to oversold (i.e. has crossed lower 100 level downwards) AND there's a valley before the last valley (possibly indicating a lasting downtrend) (when I say 'before the last valley' I mean before the valley currently being formed)
Note: When setups agree with rule 2b, it's usually because there's a strong downtrend, which means that price will probably cling to the lower band, which will violate rule 3 below. It's good in such cases to wait for price to retrace a little bit before entering. It's also good for price not to be far from MA. If price is too far from MA, that may indicate exhaustion of the trend, and an imminent reversal, at least toward MA resistance.
3] Price action (henceforth PA) has crossed middle Bollinger Band (henceforth BB) downwards or is near it (or, if everything else is looking well, at least there's some room between current price and lower extreme BB, though this latter rule may be violated when BBs are too narrow because a breakout is about to occur, commonly referred to as the Bollinger squeeze)
4] PA hasn't breached or punctured the lower extreme BB (again, this rule may be violated in case of Bollinger squeezes, or when everything else is looking really nice!)
5] Gann HiLo indicator's blue line is currently above the PA
Red Moving Average 60 (henceforth MA) plays no super significant role, other than 1) to help the trader identify the current trend (when there are consecutive CCI valleys, when Stoch tends to zigzag around the Sell area, when Gann HiLo is below the red MA, and when PA is below the red MA, then we're most probably in a downtrend), 2) to set possible TP & SL and 3) to indicate possible support and resistance areas.
SELL SL & TP:
Fractals Method (or Method 1): Last Fractal high is the SL and TP is identical: so if last Fractal high is 50 pips, TP is also 50 pips.
BB Method (or Method 2): Higher extreme BB is the SL. Lower extreme BB is the TP.
Fractals&BB Method (or Method 3): Last Fractal high is the SL and lower extreme BB is TP. This usually leads to a negative Risk Reward (RR) ratio.
BB&Fractals Method (or Method 4): Higher extreme BB is SL and last Fractal high determines TP. This is usually a positive RR ratio.
MA Method (or Method 5): SL is either last Fractal high or higher extreme BB, but TP is MA, because it may act as a resistance/support. This option might be preferable in cases when PA has been rejected by the MA in the recent past.
Good thing about placing your TP and SL according to the BBs is that they adjust to the market: as the BBs move -- maybe they become tighter, maybe they become wider -- you move your TP accordingly, tightening it or widening it respectively. It is recommended that you keep your original SL untouched, but that you move your TP according to the BBs. That way, if we picked the wrong direction, we can get out with a small profit or break even (BE).
Below is a pic of an ideal Sell Trade according to rule 2a:
Attached Image (click to enlarge)
BUY RULES - Reverse of the above:
1] Stochastic has gone from Sell region to Buy region, i.e. from 25 level to 75 level, even better if it's gone from 15 to 85. The cleaner/straighter/nicer/faster/less zigzaggy the move the better.
2a] CCI 34 has gone from oversold to normal levels (i.e. has crossed lower 100 level upwards) AND there's a peak before the last valley
OR
2b] CCI 34 has gone from normal levels to overbought (i.e. has crossed upper 100 level upwards) AND there's a peak before the last peak (possibly indicating a continued uptrend) (when I say 'before the last peak' I mean before the peak currently being formed)
Note: When setups agree with rule 2b, it's usually because there's a strong uptrend, which means that price will probably cling to the upper band, which will violate rule 3 below. It's good in such cases to wait for price to retrace a little bit before entering. It's also good for price not to be far from MA. If price is too far from MA, that may indicate exhaustion of the trend, and an imminent reversal, at least toward MA support.
3] PA has crossed middle BB upwards or is near it (or, if everything else is looking well, at least there's some room between current price and higher extreme BB, though this latter rule may be violated when BBs are too narrow because a breakout is about to occur, commonly referred to as the Bollinger squeeze)
4] PA hasn't breached or punctured the higher extreme BB (again, this rule may be violated in case of Bollinger squeezes)
5] Gann HiLo indicator's blue line is currently below the PA
MA plays no super significant role, other than 1) to help the trader identify the current trend (when there are consecutive peaks, when Stoch tends to zigzag around the Buy area, when Gann HiLo is above the red MA, and when PA is above the red MA, then we're most probably in an uptrend), 2) to set possible TP & SL and 3) to indicate possible support and resistance areas.
BUY SL & TP:
Fractals Method (or Method 1): Last Fractal low is the SL and TP is identical: so if last Fractal low is 50 pips, TP is also 50 pips.
BB Method (or Method 2): Lower extreme BB is the SL. Higher extreme BB is the TP.
Fractals&BB Method (or Method 3): Last Fractal low is the SL and higher extreme BB is TP. This usually leads to a negative RR ratio.
BB&Fractals Method (or Method 4): Lower extreme BB is SL and last Fractal low determines TP. This is usually a positive RR ratio.
MA Method (or Method 5): SL is either last Fractal low or lower extreme BB, but TP is MA, because it may act as a support. This option might be preferable in cases when PA has been rejected by the MA in the recent past.
Below is an (almost) ideal pic of a Buy Trade according to rule 2b:
Attached Image (click to enlarge)
------------------------------------------------------------------------------------------------------------------------------------------------------------------------------------------------------------
These are the essential rules of the BB Gann System, but it is highly recommended that you go through our backtests (BT) (I will post soon), mentally taking every trade one by one, reading the explanations for each trade, to familiarize yourself with this method and become as proficient as possible at trading it.
Though this system was developed on and for the H4 chart, some casual/visual BT shows it might be profitable on all timeframes, even down to the M5. But this is as yet unsubstantiated.
So far the system seems to work best on GBP pairs, as well as volatile pairs like EURAUD.
Lastly, I would like to thank (in no particular order!) the people who have either worked on this system itself or who have supported me in other ways, or just people I know! :
Soros (my positive thinking instructor), Arso (who has done more BT for this system than anyone else, myself included!), Eitan (without whom this system probably wouldn't exist), RockRobb, Sriniff (an awesome programmer), flyer415, reso09, nickcnew, Ata-Turkoglu, priceaction7, spufuz, ginger, pips777, carlosar13, BobMorane, pending, Vigovski, Cariddi, Adam84, Blackeagle, RockerZeus (who modified the CCI indicator we are using), and, just, everyone!!
Oh and here's the template for this system! (I renew whenever possible. You know it's new when it has close to 0 downloads!) :
Attached File(s)
Indicators you might be missing:
Attached File(s)
Attached File(s)
The rest are included in MT4.