I've been wandering around this forum for a while and been trading for around a year now. Still learning lots of stuff. I like to help others so posting this.
I call this the Gann Price vibration system. It is not a system by itself but is more a confirmation system. Add this to whatever method you trade and it will help you for sure.
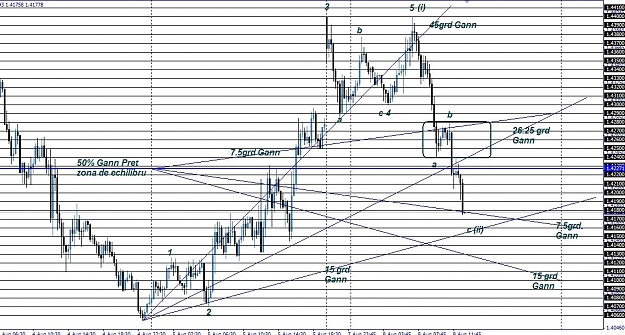
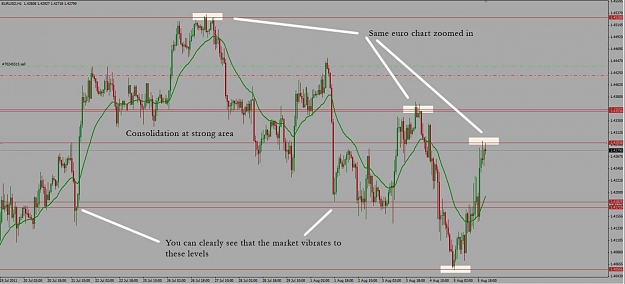
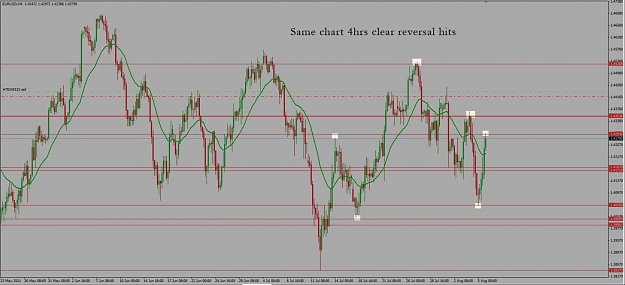
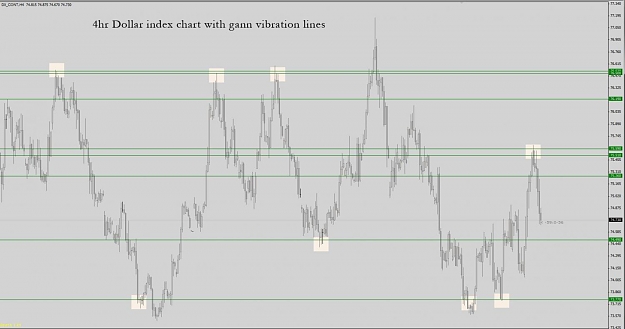
It's based on the gann wheel. From a low you can predict possible points where the market will vibrate to. Same with a high. Price will either bounce off, gap through, or blow through these levels. Thats why I call it a confirmation system.
I have attached an excel file in which you input a significant low and a high and it gives you price vibration levels. (remove the decimals when inputing the numbers) eg: 1.4320 would be 14320
Then just add the lines to you mt4 chart and you have areas to watch.
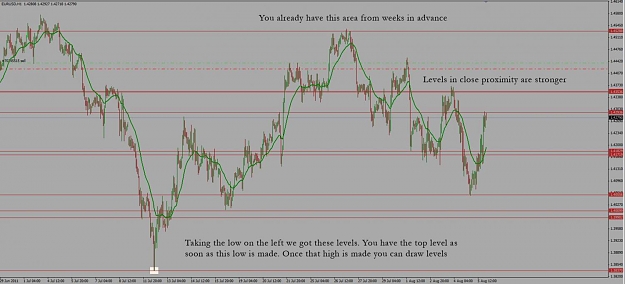
Sometimes you may just have a low you can still plot higher levels and predict vibration areas.
It works on any timeframe. I personally like to take the daily and draw my lines so I can use them interday for a long time without having to change them.
Update 2
Updated indicator can be found here thanks to brooky29
http://www.forexfactory.com/showthre...33#post5389333
I call this the Gann Price vibration system. It is not a system by itself but is more a confirmation system. Add this to whatever method you trade and it will help you for sure.
It's based on the gann wheel. From a low you can predict possible points where the market will vibrate to. Same with a high. Price will either bounce off, gap through, or blow through these levels. Thats why I call it a confirmation system.
I have attached an excel file in which you input a significant low and a high and it gives you price vibration levels. (remove the decimals when inputing the numbers) eg: 1.4320 would be 14320
Then just add the lines to you mt4 chart and you have areas to watch.
Sometimes you may just have a low you can still plot higher levels and predict vibration areas.
It works on any timeframe. I personally like to take the daily and draw my lines so I can use them interday for a long time without having to change them.
- It's also interesting to know that many times price reverses at these levels to the tick.
- Also note that when there are 2 lines in close proximity the area is stronger.
Update 1
Added a video showing how to do it. Sorry for the low quality. Hope you get the idea.
Inserted Video
Update 2
Updated indicator can be found here thanks to brooky29
http://www.forexfactory.com/showthre...33#post5389333
Attached Image(s) (click to enlarge)
Attached File(s)