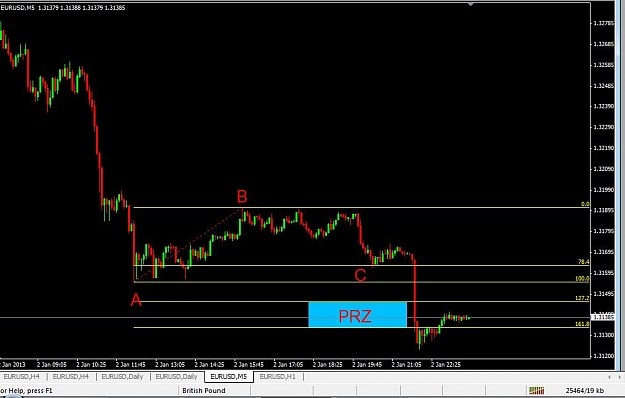
DislikedI must be a real slow learner. On the EUR 60 min chart you show the main swing as the red line on the chart I have attached. Isn't the main swing the magenta line on the chart? Sorry to keep going back to the basics. If you have time maybe you could show a few more charts
with main swings. How do you determine which direction tom trade and how do you determine where (what swings) to pull your fibs and extensions from.
I must admit I'm a bit lost.
Also you showed a 244 tick chart on one of your post, is that roughly equal to a 1 min chart...Ignored
The 244 tick is pretty close to the 1 M I believe Bary looked at it. He can probably comment further I believe he was testing this very thing.
If you fail to plan, you plan to fail.