Key levels & correlation trading
There is no holy grail in trading but if there is something that comes close to it it is a clear understanding of price and its interaction with important key levels.
First off however we need to know what defines a key level.
Key level understanding
A key level is a level in the market that consists of big confluence. Confluence can come in multiple ways and they are in general made by the following group of traders:
· Support and resistance traders
· Fibonacci level traders
· Pure trendline traders
· Round level traders
· Pivot point traders
· Supply & demand traders
· Moving average traders
Further confluence would be added when using oscillator indicators like MACD/Stoch but since we want to keep trading as simple as possible/limit our confirmations we are not going to use that for this method. Besides that we want to have a hard solid zone so we can set precise stops above or under this key level. Divergence can take some time to play out and will only make this zone bigger. Plot all(or most) of the above on your charts, see the importance of these zones/how price interacts with them. It is really that simple.
What do we see when multiple confluence factors are coming together in one area? ->One big orderflow. This is because all groups of traders are going to make important decisions around these areas. You will see big new parties entering the markets at these key levels. Entries will only be made at key levels for optimal R:R. Entries based on price structure on a low timeframe provides you to be the very first, you will enter before any indicator(based on MA) traders and even before price action traders(based on price interaction that has already occurred around these levels). We anticipate what price will do when price will reach a key level and we will do so by analyzing direct market sentiment on a low timeframe. We then either enter the market or we don’t when price touched the key level.
Confluence setups
">{1}
Above shows multiple confluence and several potential setups that took place in the past. Notice that at some of these setups we don’t see enough buyers or sellers on the 5M chart. However, they can be spotted on the 1M chart. In my opinion 1M is a must to get a correct view on actual buyers and sellers in the market and if the sentiment is changing rapidly. Based off the 5M AND 1M we can check whether a trendline/key level is likely to hold or break.
-----------------------------------------------------------------------
Price strenght and weakness
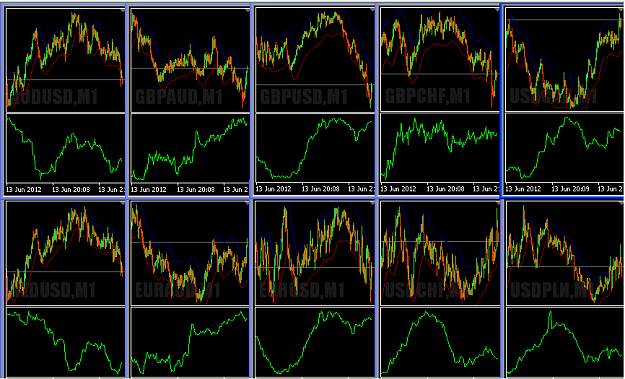
A big myth in the market in general is the fact whether real weakness and strength in price can be measured. After all price will include the actual traders in the market, new players, stopped & manual excited players and it quite doesn’t stop there… EUR/USD is moved by euro strenght/weakness and dollar strength/weakness. Price on your chart is influenced by shown factors, as well as unseen factors.Shown factors can be well defined as trends, unseen is to be unseen but can be predicted when there is a good understanding of the earlier mentioned key levels and currency correlation.
In short,for a complete picture of what price is doing and what it is going to do in the near future we will respectively look at how price is trending at a given moment, correlation at a given moment, and important key levels of where new parties will most likely enter.
-----------------------------------------------------------------------
Keylevel interaction
We have an overview of important key levels marked. We have a view on short term price sentiment. Understanding 1M price structure/sentiment can tell us if a key level is likely to hold, or break.As mentioned before we will aim to watch price approach a keylevel and counter trend trade if price is showing severe signs of weakness.
So we now know some of the important forces that moves a currency. By analyzing pure market sentiment on 1M and combining it with important key levels on a fully zoomed out 5M( I recommend using Heiken Ashi for engulfed R/S spotting as regular candlesticks will not work on fully zoomed charts ) chart for oversight we have everything we need, except for correlation.
One minute underlying price structures
One minute time frame provides you with a clear view on price structures beneath 5M+ candle engulfment. We can check for ourselves whether price is either building momentum or is weakening towards a defined key level. First possible key level didn't show us any signs of buyers or weakening structures. Patience would have gotten you into a way better entry with buyers around at trendline + pivot confluence.
Keep in mind that short term 1M TL’s indicate buyers or sellers around and will at the 15M +TF usually show as big engulfed candles and whipsaw patterns. This will definitely cause even more sellers or buyers to enter the market. Redsword(Price is everything) and KennyZ(Romancing the price) are masters of these patterns on these timeframes. Myself I got inspired by them and it motivated me to remove all indicators and analyze pure price. For more information on whipsaw/engulfment trading visit redswords “Price is everything” and KennyZ “Romancing the price”.
Below are 2 vid’s I found on youtube that are using similar ways to view the market when it comes to keylevels and price interaction.
If these links are considered as commercial use I will remove them immediately because I would like to keep this topic in trading discussion.
-----------------------------------------------------------------------
Mindset I am not going to dedicate a big part of the psychology in this topic because there are countless of topics regarding this matter that can be found on the forum already. For this system it is important to be able to cut losses short.. And I mean real short. If price goes through your pre-defined key level close it out immediately and completely. Your edge is to be found in pinpointing exact entries from confluence levels and the one minute TF. Don’t destroy that edge by holding on to losing trades. -----------------------------------------------------------------------
Implementation I know it might be hard to implement methods like this to your trading plan because there are no fixed variables in which you enter the market. In other words, you will not enter the market when price moves above an MA or when price reaches certain overbought and oversold area. Benefiting from this system is only achievable if you spend a considerable amount of time to understand these market structures and know when to trade, and when to avoid it.
I am still only at the end of my first year in trading and I barely managed to be breakeven last couple of weeks. However, I do think there is much potential in these methods. I would not call this a system. It is a way to view the market. Therefore I’m wondering if you are using similar methods/ways to view the market and like to discuss it in this topic. Unfortunately I don’t have much time on my hand these weeks because of my fulltime job but I will add some setups when I have time again, which will be in around 6 weeks. Right now I don't have much time to answer questions but I will do so whenever possible..I hope you found this useful and that some of its elements might help you in grabbing potential pips.
Be sure to read the second part about correlation!
There is no holy grail in trading but if there is something that comes close to it it is a clear understanding of price and its interaction with important key levels.
First off however we need to know what defines a key level.
Key level understanding
A key level is a level in the market that consists of big confluence. Confluence can come in multiple ways and they are in general made by the following group of traders:
· Support and resistance traders
· Fibonacci level traders
· Pure trendline traders
· Round level traders
· Pivot point traders
· Supply & demand traders
· Moving average traders
Further confluence would be added when using oscillator indicators like MACD/Stoch but since we want to keep trading as simple as possible/limit our confirmations we are not going to use that for this method. Besides that we want to have a hard solid zone so we can set precise stops above or under this key level. Divergence can take some time to play out and will only make this zone bigger. Plot all(or most) of the above on your charts, see the importance of these zones/how price interacts with them. It is really that simple.
What do we see when multiple confluence factors are coming together in one area? ->One big orderflow. This is because all groups of traders are going to make important decisions around these areas. You will see big new parties entering the markets at these key levels. Entries will only be made at key levels for optimal R:R. Entries based on price structure on a low timeframe provides you to be the very first, you will enter before any indicator(based on MA) traders and even before price action traders(based on price interaction that has already occurred around these levels). We anticipate what price will do when price will reach a key level and we will do so by analyzing direct market sentiment on a low timeframe. We then either enter the market or we don’t when price touched the key level.
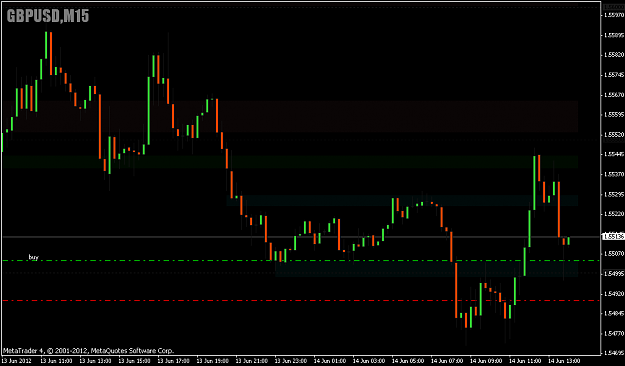
Confluence setups
">{1}
Above shows multiple confluence and several potential setups that took place in the past. Notice that at some of these setups we don’t see enough buyers or sellers on the 5M chart. However, they can be spotted on the 1M chart. In my opinion 1M is a must to get a correct view on actual buyers and sellers in the market and if the sentiment is changing rapidly. Based off the 5M AND 1M we can check whether a trendline/key level is likely to hold or break.
-----------------------------------------------------------------------
Price strenght and weakness
A big myth in the market in general is the fact whether real weakness and strength in price can be measured. After all price will include the actual traders in the market, new players, stopped & manual excited players and it quite doesn’t stop there… EUR/USD is moved by euro strenght/weakness and dollar strength/weakness. Price on your chart is influenced by shown factors, as well as unseen factors.Shown factors can be well defined as trends, unseen is to be unseen but can be predicted when there is a good understanding of the earlier mentioned key levels and currency correlation.
In short,for a complete picture of what price is doing and what it is going to do in the near future we will respectively look at how price is trending at a given moment, correlation at a given moment, and important key levels of where new parties will most likely enter.
-----------------------------------------------------------------------
Keylevel interaction
We have an overview of important key levels marked. We have a view on short term price sentiment. Understanding 1M price structure/sentiment can tell us if a key level is likely to hold, or break.As mentioned before we will aim to watch price approach a keylevel and counter trend trade if price is showing severe signs of weakness.
So we now know some of the important forces that moves a currency. By analyzing pure market sentiment on 1M and combining it with important key levels on a fully zoomed out 5M( I recommend using Heiken Ashi for engulfed R/S spotting as regular candlesticks will not work on fully zoomed charts ) chart for oversight we have everything we need, except for correlation.
One minute underlying price structures
One minute time frame provides you with a clear view on price structures beneath 5M+ candle engulfment. We can check for ourselves whether price is either building momentum or is weakening towards a defined key level. First possible key level didn't show us any signs of buyers or weakening structures. Patience would have gotten you into a way better entry with buyers around at trendline + pivot confluence.
Keep in mind that short term 1M TL’s indicate buyers or sellers around and will at the 15M +TF usually show as big engulfed candles and whipsaw patterns. This will definitely cause even more sellers or buyers to enter the market. Redsword(Price is everything) and KennyZ(Romancing the price) are masters of these patterns on these timeframes. Myself I got inspired by them and it motivated me to remove all indicators and analyze pure price. For more information on whipsaw/engulfment trading visit redswords “Price is everything” and KennyZ “Romancing the price”.
Below are 2 vid’s I found on youtube that are using similar ways to view the market when it comes to keylevels and price interaction.
Inserted Video
Inserted Video
If these links are considered as commercial use I will remove them immediately because I would like to keep this topic in trading discussion.
-----------------------------------------------------------------------
Mindset I am not going to dedicate a big part of the psychology in this topic because there are countless of topics regarding this matter that can be found on the forum already. For this system it is important to be able to cut losses short.. And I mean real short. If price goes through your pre-defined key level close it out immediately and completely. Your edge is to be found in pinpointing exact entries from confluence levels and the one minute TF. Don’t destroy that edge by holding on to losing trades. -----------------------------------------------------------------------
Implementation I know it might be hard to implement methods like this to your trading plan because there are no fixed variables in which you enter the market. In other words, you will not enter the market when price moves above an MA or when price reaches certain overbought and oversold area. Benefiting from this system is only achievable if you spend a considerable amount of time to understand these market structures and know when to trade, and when to avoid it.
I am still only at the end of my first year in trading and I barely managed to be breakeven last couple of weeks. However, I do think there is much potential in these methods. I would not call this a system. It is a way to view the market. Therefore I’m wondering if you are using similar methods/ways to view the market and like to discuss it in this topic. Unfortunately I don’t have much time on my hand these weeks because of my fulltime job but I will add some setups when I have time again, which will be in around 6 weeks. Right now I don't have much time to answer questions but I will do so whenever possible..I hope you found this useful and that some of its elements might help you in grabbing potential pips.
Be sure to read the second part about correlation!