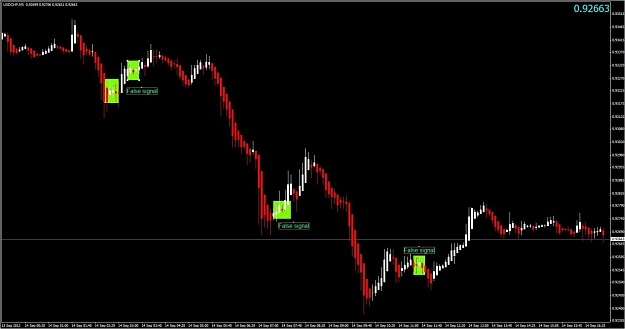
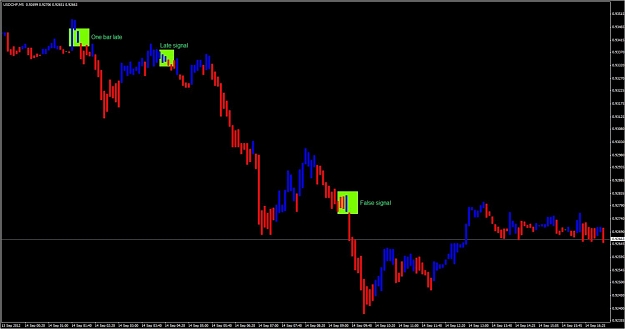
Both indicators are great at spotting trends, but I'm not so sure about helping us with the precise entry and exit points as they don't show the exact price movement. Heiken Ashi candle bar displays the average relative to previous bars, 3-line break displays the high and the low relative to previous bars.
Both have pros and cons as displayed on the screenshots, but combining them in one chart may not be a good idea either. Anyone knows the proper way to trade with these two? Is one superior to the other? Are both superior to the normal candlestick chart?
I personally found that different time frame affects their effectiveness. They seem to perform better at lower time frames (30 m and lower, but not 1 m). But they both are way better than the usual candlestick chart, and this makes my knowledge of candlestick patterns obsolete.
Thanks guys.
Attached Image(s) (click to enlarge)