Dislikedbut then again... UJ's higher TFs are best when i need to figure out that little bastard. anything lower than that is just plain BS...
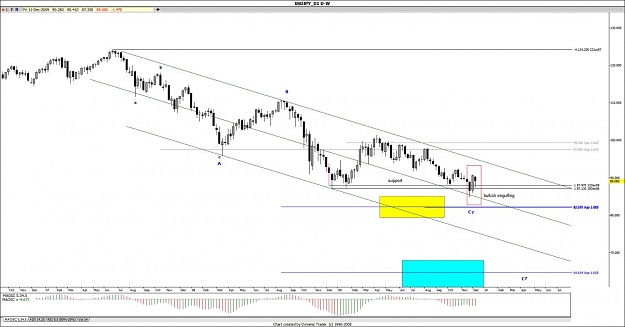
weekly chart's telling me there's a very strong confluence of an FE 61.8 level (which is toughest to break when it comes to ABC patterns) and a fibo fan level.
you guys can see the last wave down on the weekly chart's pretty much respecting a the expanding channel created by fibo fan level 38.2 and 50.0.
also cci30 (which is also best on the weekly chart) is showing a triangle ready to get busted either...Ignored
personally, i'm not seeing the move down from 124 area as impulse wave (5 waves). i was thinking about the count you have on your chart, but the major problem i had with that count was the wave 1. if you look at the sub-waves of wave 1, the wave 3 of 1 is the shortest compared to wave 1 and 5 of wave 1, which leads me to believe that this is not an impulse wave. so, i think the down move should be counted as abc correction. looking at weekly chart, price came lower than 87 but went above the support on following week, creating a bullish engulfing pattern. if the price does not reverse from here then i currently have 2 areas to consider long again. 80 area (monthly support) and 64 area which is FE 161 of the down move.
Attached Image (click to enlarge)