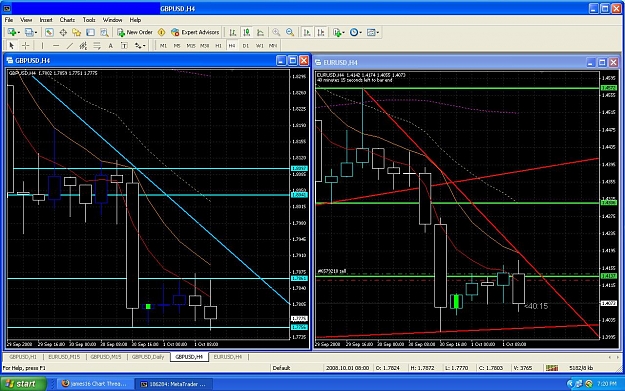
Trading any market type is a lot easier when you mark out prospective support/resistance flip areas. When you plan ahead and are waiting for an event to happen it's a lot easier to pull the trigger with confidence and stick to your trade management ideals.
Without the drawn in blue lines, the U/J 4 hour chart looks like an undecided mess. Get good at reading this aspect of your charts and you'll find a way to trade sideways price action too.
Given chart...
Yellow arrows point to hint of a good pivot zone forming. This type of respect (second arrow and pin that formed) tells me it's a good "trading zone". Yellow "x" marks are bars that showed further respect. Later on, two further pins would have given great trades.
The two dotted blue lines are also minor pivot areas that act as guides (for me).
...Personally, I am very weary of entering too close to price 'traffic jams' such as these. ...BUT also, plotting these can give you confidence to wait out price move pauses and quick, temporary rebounds, etc. If you are expecting a short move, exiting at these is an option. Even taking part profits and so on. (On lower time frames they will become trading zones. ) Your preference. Yours to practice.
Lots of ways to trade all these of course, but the key is seeing those pivot areas and looking for the potential in any possible move first before waiting for your great entry.
Remember that it's still all about picking the best trades, no matter what type of market condition you are trading.
I'm watching this chart to see what happens.
Ignored
Thank you Bundy! I still don't really know what a ppz is. From reading back threw the thread I would venture a guess that its a "price pivot zone" and is an area that has acted as both support and resistance? Thank you so much for the chart. I am attaching a chart for critique please and tell me if I have the idea correctly.
Thank you Bundy! I still don't really know what a ppz is. From reading back threw the thread I would venture a guess that its a "price pivot zone" and is an area that has acted as both support and resistance? Thank you so much for the chart. I am attaching a chart for critique please and tell me if I have the idea correctly.
Ignored
yes a PPZ is simply an "area" where there is a flip b/w support and resistance
These can be zones, and are often not one specific point. Often times they line up with other things such as round numbers
Thanks Mike, You are the man ! My pc was down most of Sunday and Monday. PC hell, had to run sys recovery, use chkdsk to fix bad sectors on my HD, reloaded vid drivers and ran driver sweeper and even cleared the cmos on the motherboard. :nerd: That being said, I missed the throwback pin on EU 4hour. It broke the flag down, then retraced and threw a huge hammer. I don't want to chase a market but I really regret missing this move. You mentioned before that their are several ways to "catch" a market. Would mind mentioning one please?
Edit: Like wait for a rally to short, or wait for a new consolidation to form or ...just sit on your hands and wait?
oleman: . . . . Tue, Dec 10, 0:31AM CST (-0600 GMT) m& tb:on TA--some folks use a lot of it, some not so much. I've got 0ver $5,000 worth of books& I've read em all. When my son got ready to learn to trade, I had him read 4 --that's FOUR--that's all. I use Trade Station 4.0. It comes with every know TA method & indicator bjuilt in. I use only: Trendlines,moving averages, parallel lines, MACD, and horizontal lines. I'm interested only in tools that help me follow PRICE. Its a lot simpler than most folks think..............m &tb: if you're just starting, read John Murphy's "Technical Analysis------". Then read it again. Then study it. Then develop a system & paper trade it for 3-6mos, before you use real$. If you feel you must be in the markets before you have the requisite knowledge, read O'Higgins "Beating the Dow" & do what it says. If you do this you will beat 99% of private investors and 95% of mutual funds..........
I've had several pm's asking for oleman, so I just dug his stuff up. When I read this part I couldn't help but be reminded of James telling us about PA, and him saying "this stuff is dirt simple folks". Finally the emphasis on demoing for at least 3 months profitable in a row.
Jason
Thanks Mike, You are the man ! My pc was down most of Sunday and Monday. PC hell, had to run sys recovery, use chkdsk to fix bad sectors on my HD, reloaded vid drivers and ran driver sweeper and even cleared the cmos on the motherboard. :nerd: That being said, I missed the throwback pin on EU 4hour. It broke the flag down, then retraced and threw a huge hammer. I don't want to chase a market but I really regret missing this move. You mentioned before that their are several ways to "catch" a market. Would mind mentioning one please?
Edit: Like wait for a rally to short, or wait for a new consolidation to form or ...just sit on your hands and wait?
Thanks,
Jason
Ignored
Hmm, I don't think I quite understand your question.
For me generally my thinking is this.
1. Is there a trending market(specific to the timeframe I am looking at).
2. If yes where are we at in that trend(ie, retracement - so we can look for confirming PA at specific levels / or are we consolidating, which in that case we look for a BO with the trend confirmed by PA).
Then you have.
Reversals
1. Are we at an extreme high and low?
2. Is there confluence(double bottom, divergence, round numbers).
3. What does the PA look like(ie, a long nose pinbar that is larger then the move and shows considerable reaction.
but Mike, you never take setups based in Steve Nison (i never read the book) candles?
thanks for aways answer my questions.
Ignored
nope never read to much of his stuff, too many patterns if you ask me(just my opinion). I like to concentrate on the patterns James teaches and just try to keep things simple and in the end to me it is all about location location location
nope never read to much of his stuff, too many patterns if you ask me(just my opinion). I like to concentrate on the patterns James teaches and just try to keep things simple and in the end to me it is all about location location location
Minus the mess, if we would see that IB break to the downside, I would put probabilities on seeing it move much lower considering the resistance we are at right now.