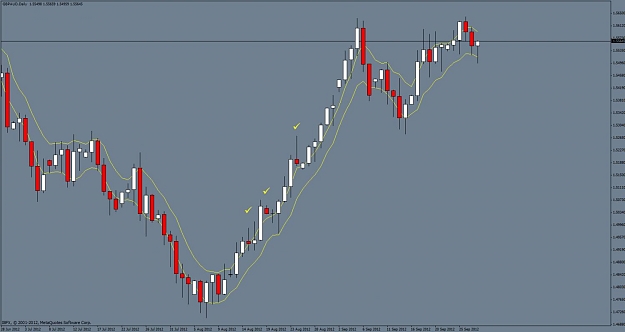
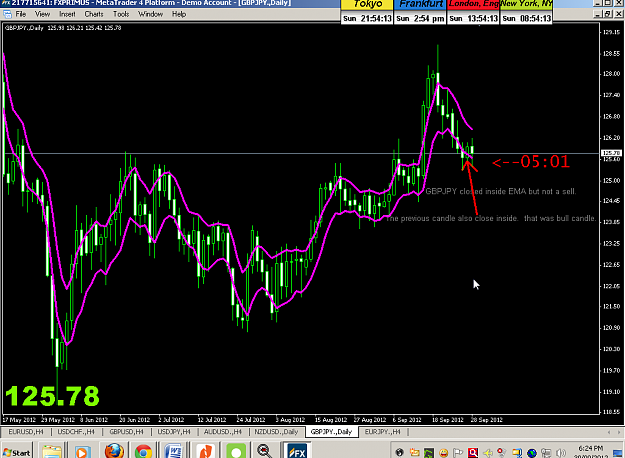
Look at the 3 check signs. The candles are not closing inside the channel so we dont have a short signal. (To be honest with you I would still enter with the 3rd check because of the pinbar..love them..yes it would turn to be a loss)
Please suggest a simple & effective Method/System of "Trading System" Forum to newbie 180 replies
Day Trading system - Simple system to make money 51 replies
Trapping System: Way to Fully-Automated Trading System 47 replies
The7 Trading Method Signals Thread 136 replies
DislikedPlace a 5 EMA High and 5 EMA Low on the chart. Short when candle closes inside the channel, same for long. Let it run until you see opposite signal. Stop Loss is high/low from last candle.
Lets start rolling...Ignored
DislikedWith this system we are trying to catch the trend from the start, with the very first candle. Meaning if the candle that closes inside the channel is red go short, if its blue go long..Ignored
Disliked"If candle closes inside the channel I enter the trade" With all due respect dont know how else to word, structure and sentence this differently...Ignored
DislikedWith this system we are trying to catch the trend from the start, with the very first candle. Meaning if the candle that closes inside the channel is red go short, if its blue go long..Ignored
DislikedI appreciate the backtesting. Can you try the test with the candle open on GMT0 please?? Thats what I use..Ignored
DislikedThen you have entries and exits nearly every day, because nearly every candle closes inside the channel. Why is it, do you think, that so many people are having difficulty understanding what you are doing? Is it all of us? Why not clarify? Such as, if candle exits the channel to the downside, when it comes back up and closes inside the channel I go long. Something like that? Anything? Just "if candle closes inside the channel I enter the trade" tells us nothing about direction; which way did the candle enter the channel from? Which way did you...Ignored
// Short when candle closes inside the channel if(priceOpen() > EMA5H && priceClose() < EMA5H && priceClose() > EMA5L) enterShort(); // same for long. Let it run until you see opposite signal if(priceOpen() < EMA5L && priceClose() > EMA5L && priceClose() < EMA5H) enterLong();
Walk-Forward Test The7 portfolio - performance report Simulation period 05.04.2008-07.08.2012 Test period 17.03.2010-07.08.2012 WFO test cycles 7 x 10⁶ bars (153 days) Training cycles 8 x 600 bars (124 weeks) Lookback time 80 bars (115 days) Gross win/loss $2325 / -$1029 (16190 pips) Average profit $541/year, $45/month, $2/day Max drawdown -$165 (MAE -$178) Max down time 231 days from Aug 2010 Largest margin $48 Trade volume $139556 ($58322/year) Capital required $213 Number of trades 156 (65/year) Percent winning 62% Max win/loss $121 / -$61 Avg trade profit $8 (+$24 / -$17) Avg trade bars 21 (+24 / -18) Max trade bars 91 (131 days) Time in market 456% Max open trades 10 Max win/loss streak 13 / 6 Annual return 255% Profit factor 2.26 (PRR 1.80) Sharpe ratio 1.67 Kelly criterion 1.10 OptimalF .012 Ulcer index 6% Prediction error 42% Trade details OptF ProF Win/Loss Cycles AUD/USD total .039 1.78 29/21 \X/\/X/ EUR/USD total .087 3.92 33/19 /X/X/X/ USD/CAD total .083 1.05 34/20 XXX/X/X total .000 ---- 0/0 ....... AUD/USD:L .067 2.91 19/8 \//./// AUD/USD:S .011 1.17 10/13 \\/\/\/ EUR/USD:L .036 1.79 15/10 .////\/ EUR/USD:S .137 7.03 18/9 /\/\/// USD/CAD:L .083 1.60 15/11 /\\///\ USD/CAD:S .000 0.87 19/9 \///\//