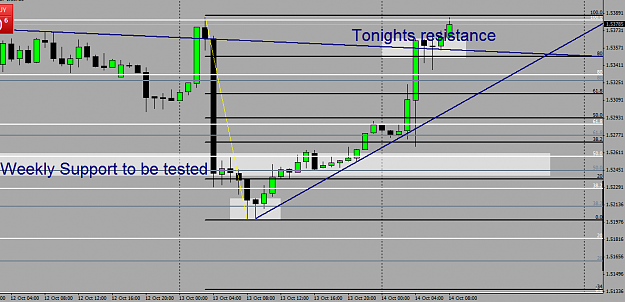
In this thread I will only use Fibonacci and diagonal trend lines, nothing else....well, maybe those little emoticon dudes.
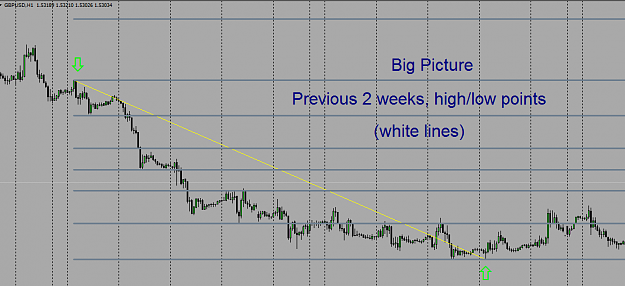
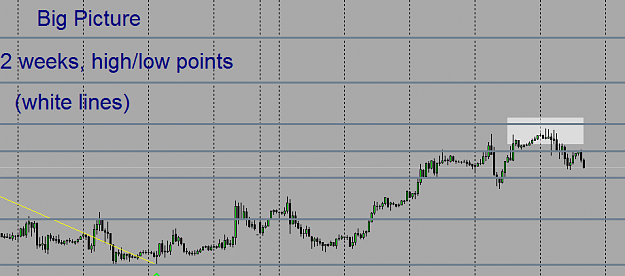
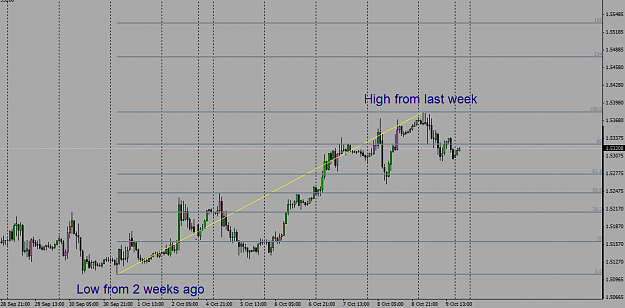
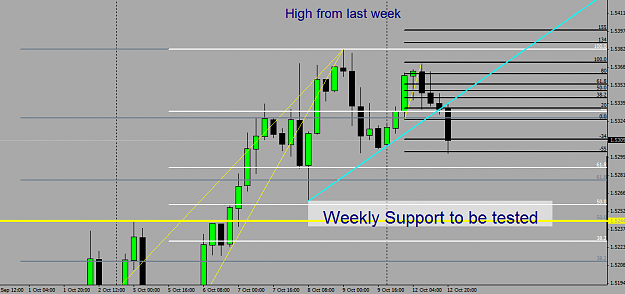
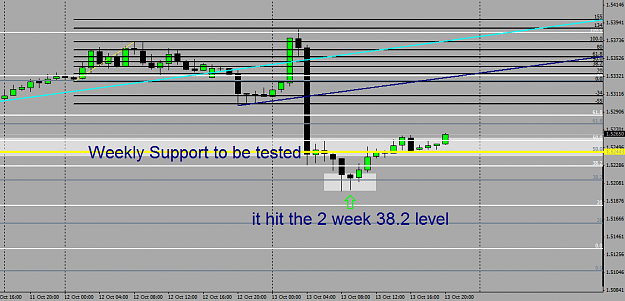
Big picture will have high/low points of the previous 2 weeks...this will be the first set of fibs....in slate gray.
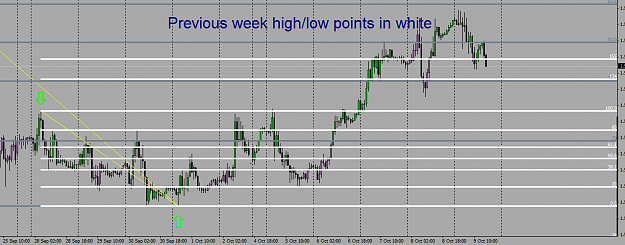
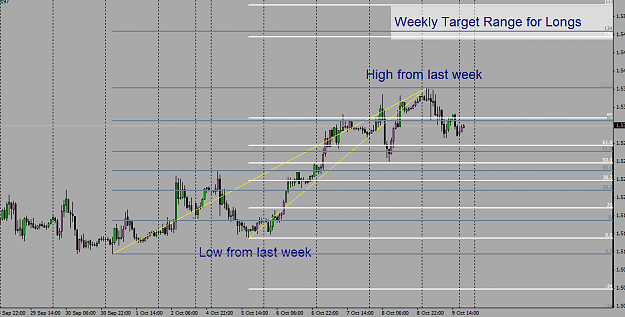
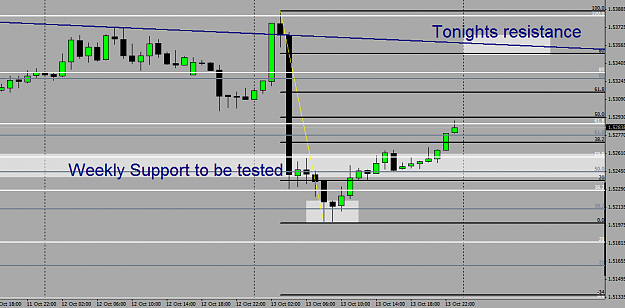
Intermediate picture will contain the high/low points of the previous week...this will be the second set of fibs...in white.
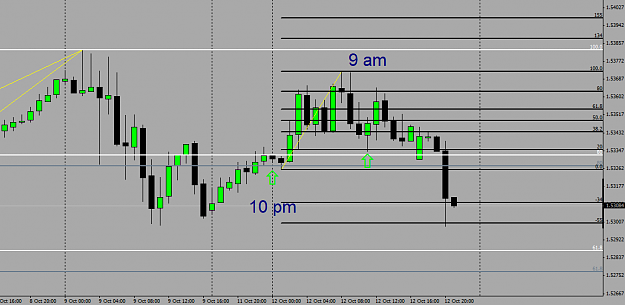
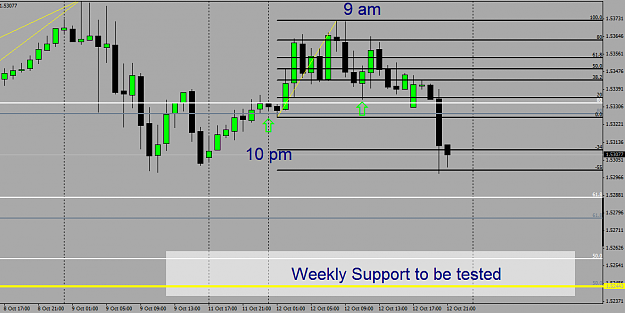
Trading day will contain the high/low points from the previous trading day taken from 10 pm MST to 10 am MST...in black.
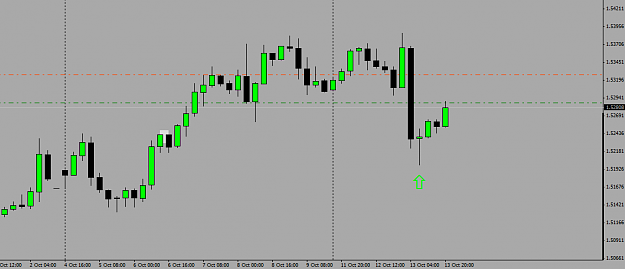
Daily chart gives me the big visual, 4 hour chart is stable but I usually trade off the 1 hour chart and sometimes will monitor the 15 minute for either pullbacks during a run or when watching for a specific candle when I anticipate a reversal.
Two things to remember here...the importance of the 50% level and what type of candles are forming...
Bottom line? No indicators boys, nothing but price action.
Big picture will have high/low points of the previous 2 weeks...this will be the first set of fibs....in slate gray.
Intermediate picture will contain the high/low points of the previous week...this will be the second set of fibs...in white.
Trading day will contain the high/low points from the previous trading day taken from 10 pm MST to 10 am MST...in black.
Daily chart gives me the big visual, 4 hour chart is stable but I usually trade off the 1 hour chart and sometimes will monitor the 15 minute for either pullbacks during a run or when watching for a specific candle when I anticipate a reversal.
Two things to remember here...the importance of the 50% level and what type of candles are forming...
Bottom line? No indicators boys, nothing but price action.
Everything easy was hard at first