Hi Guys (new member, first post etc)
OK, I know this journal isn't about ccy's, but I hope you can all forgive me . Another thing to add is that I might not start posting actual trades until... well maybe not until next week, but I want to go over the basics before I start posting the trades.
So, lets get into the nitty gritty of the strategy:
Instruments
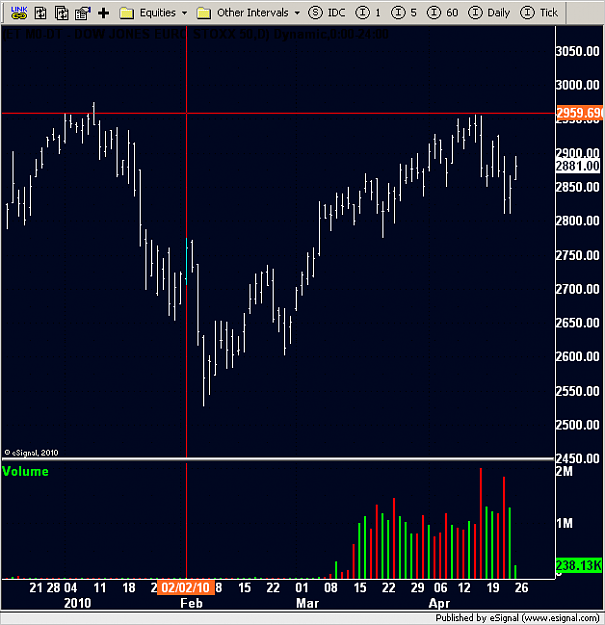
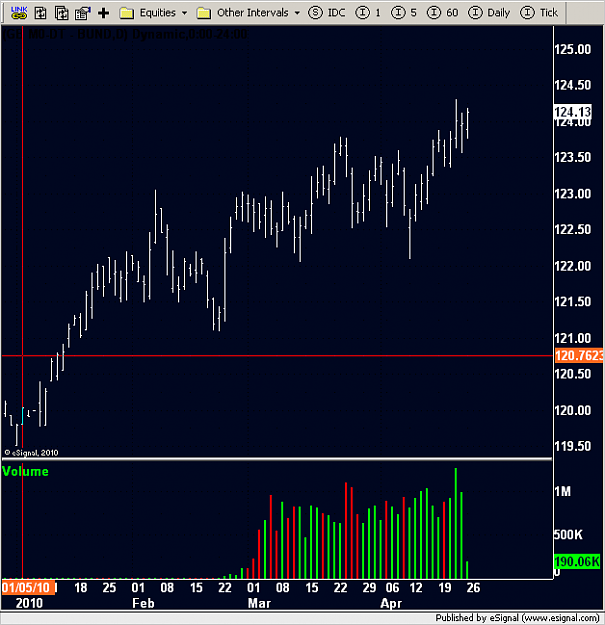
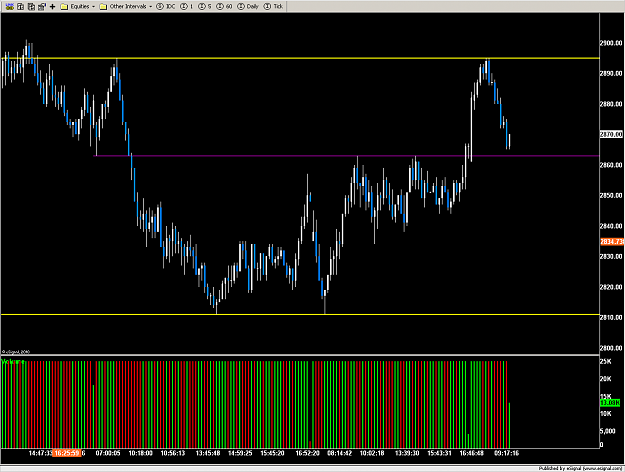
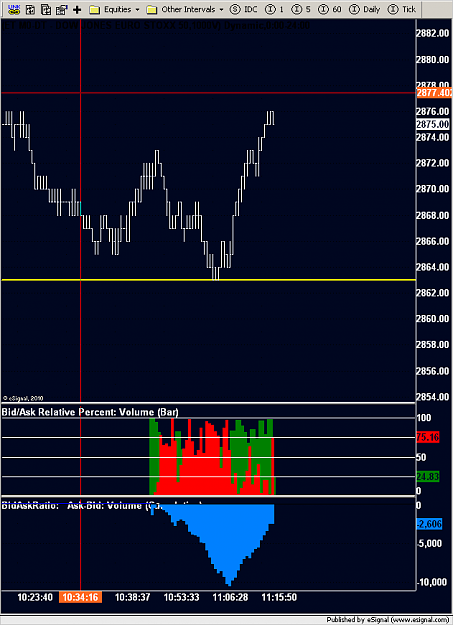
The trades I post will be for the popular Eurex futures contracts - EuroStoxx 50 futures and Bund futures. I will look to make trades between 07:00 and 18:00 for Bunds, and 08:00 - 18:00 for the Stoxx (the cash market in equities doesn't open until 08:00, thats why). I won't hold any overnight trades, which means I will have to close positions by 21:00 at the latest (the exchange closes).
Strategy basics
The strategy is basically comprised of two factors:
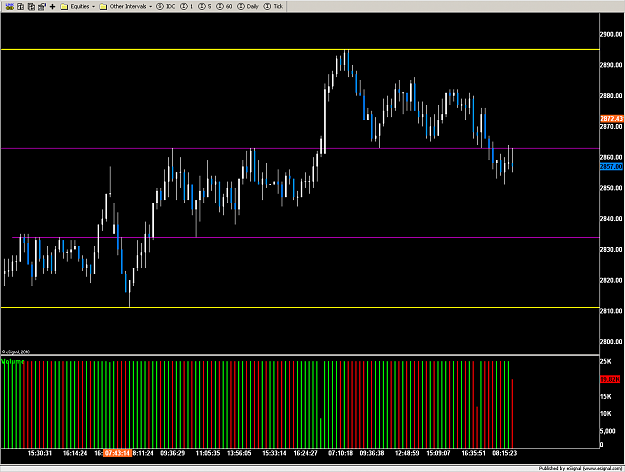
1) Mark out important prices in the market structure
This basically means support / resistance. All prices are not created equal, some are more important than others - the first part of the strategy is to highlight the important ones and only pay attention to these.
2) Watch the price action at these important levels
When we get to these levels, we watch the behaviour to get a heads up of the new price discovery bias (which way it is likely to go).
My Strategy specifics
I will be using volume bars at two different intervals (initially, 20k and 2k, but these are susceptible to change) - a bar/candlestick is formed when x many contracts have traded. Volume is the lifeblood of any market! I know getting accurate volume figures can be tricky in forex, but I guess you could use tick/range bars or plain old time bars if you wanted. You guys play around with it and post your results if you want.
What are we looking for?
The quickest way to explain is by looking at the pdf's I'll attach, but just in case...
The support/resistance part is pretty self explanatory, so I'll concentrate on the lower timeframe (well, "volume" frame) stuff...
The lower TimeFrame (TF) will be used for entries only. We are going to concentrate on the swing highs and swing lows - we all know the Lower Low / Lower high idea, and it's for a change in this dynamic that gets us into a position. We seperate the Highs / Lows into a leading edge and a lagging edge. In a downtrend, the swing lows are the leading edge, and the swing highs are the lagging edge (and vice versa). If we don't get any clear indication of the bias from the price action, we define the price as rangebound and switch to a breakout strategy.
If you look at the " Long Entry" PDF, I have seperated it into three parts. The first part is what we look for in a trade off support (just reverse it all for shorts off resistance)...
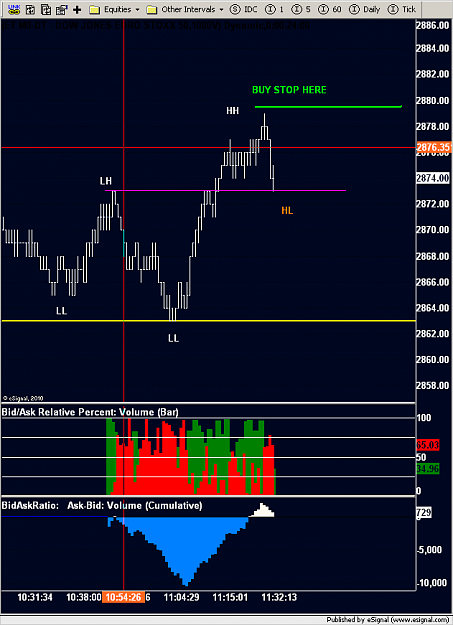
1) Long entry
At support, we are set to "amber" once we get a weaker leading edge - in this case, a Higher Low. we then put orders in to trigger a trade long once we get a break of the lagging edge - in this case, a Higher High. The stop goes behind the Higher Low.
However, it doesn't always work like this, so we need to be prepared for chop...
2) Range Definition
If we are set to "amber" and waiting for the green light, but the Higher Low is breached (thereby setting a Lower Low), we pull the order and set the range as appropriate - we are then on the lookout for a...
3) Breakout Strategy
Once we have set a range, the next step is to wait for price to trade outside the range. If we trade above the range we look for longs, short if we trade below. We wait for a pullback after the breakout (so we know where to put our stop) and put an order in above the high / below the low.
One thing to note is that firstly, we are looking for a reversal - but if (by our definitions) price goes into a range, we can trade either long OR short.
Thats about it for entries.
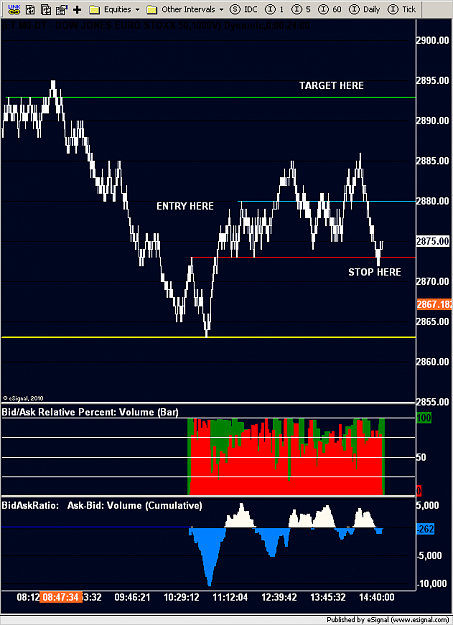
EXITS
As I mentioned earlier, our lower TF is ONLY used for entries. In my experience, micro managing trades on a lower TF gets you out too early. My basic philosophy on lower time frames (however you define low) is that they are only useful some of the time; when you think there may be some signal because of the particular context of the wider market. If the current price isn't significant in term of market structure (i.e. at or near a particular support or resistance level) then everything on the lower TF is just noise generated by order flow.
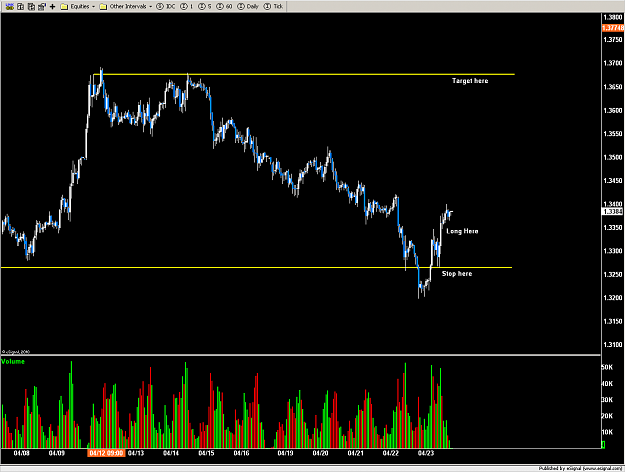
It follows, then, that our exits are managed on the Longer TF. Plain and simple, we look for the next significant level in the market, and set our targets a tick or two before it. Stops behind pullbacks, but only pullbacks on the higher TF, not the lower.
Example
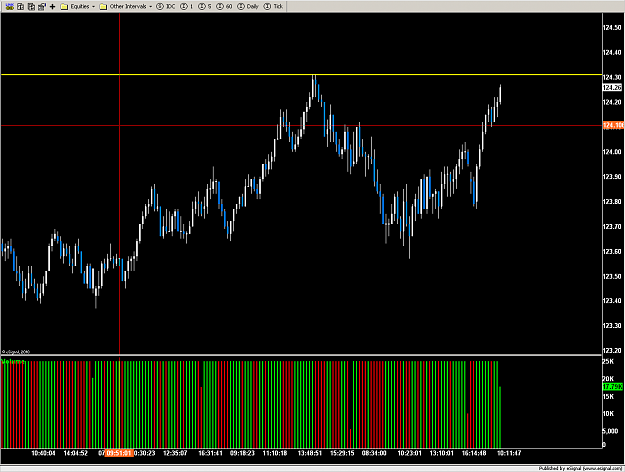
The following example is from EUR/USD (I will try and post setups on the major intruments if and when I get the time, but I thought I'd post a forex one for you guys on my first post).
Firstly, we will have marked out the low of 25th March as a significant price in the market structure.
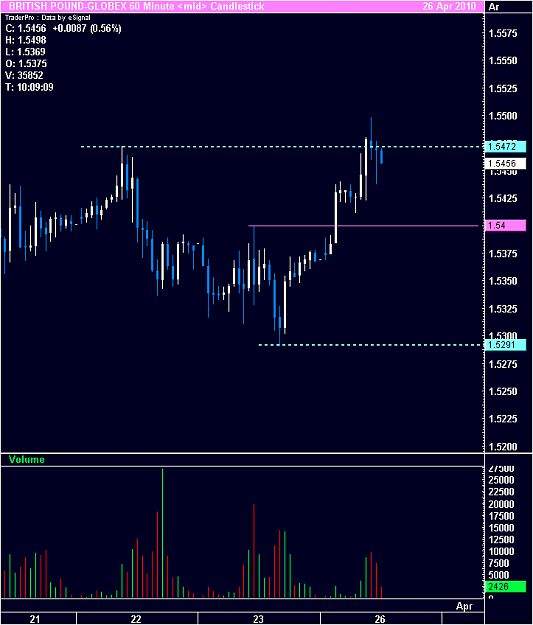
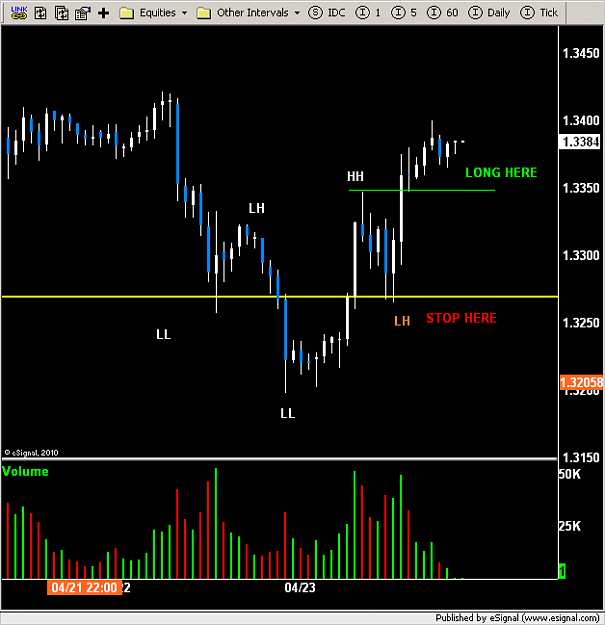
We then look at our lower TF (in this case, 60m) for an entry...
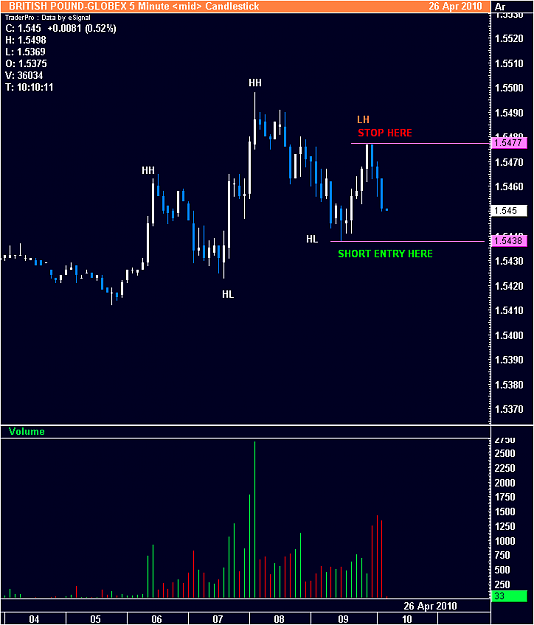
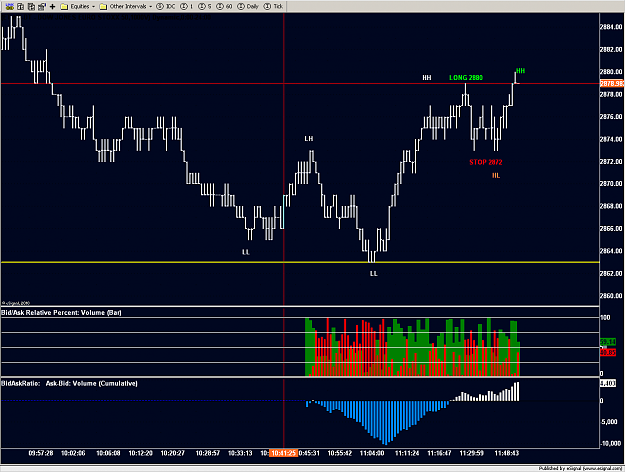
in this example, we see a long entry triggered by the sequence...
I'm pretty sure I will have left something out, so any questions just ask, and please feel free to comment!

OK, I know this journal isn't about ccy's, but I hope you can all forgive me . Another thing to add is that I might not start posting actual trades until... well maybe not until next week, but I want to go over the basics before I start posting the trades.
So, lets get into the nitty gritty of the strategy:
Instruments
The trades I post will be for the popular Eurex futures contracts - EuroStoxx 50 futures and Bund futures. I will look to make trades between 07:00 and 18:00 for Bunds, and 08:00 - 18:00 for the Stoxx (the cash market in equities doesn't open until 08:00, thats why). I won't hold any overnight trades, which means I will have to close positions by 21:00 at the latest (the exchange closes).
Strategy basics
The strategy is basically comprised of two factors:
1) Mark out important prices in the market structure
This basically means support / resistance. All prices are not created equal, some are more important than others - the first part of the strategy is to highlight the important ones and only pay attention to these.
2) Watch the price action at these important levels
When we get to these levels, we watch the behaviour to get a heads up of the new price discovery bias (which way it is likely to go).
My Strategy specifics
I will be using volume bars at two different intervals (initially, 20k and 2k, but these are susceptible to change) - a bar/candlestick is formed when x many contracts have traded. Volume is the lifeblood of any market! I know getting accurate volume figures can be tricky in forex, but I guess you could use tick/range bars or plain old time bars if you wanted. You guys play around with it and post your results if you want.
What are we looking for?
The quickest way to explain is by looking at the pdf's I'll attach, but just in case...
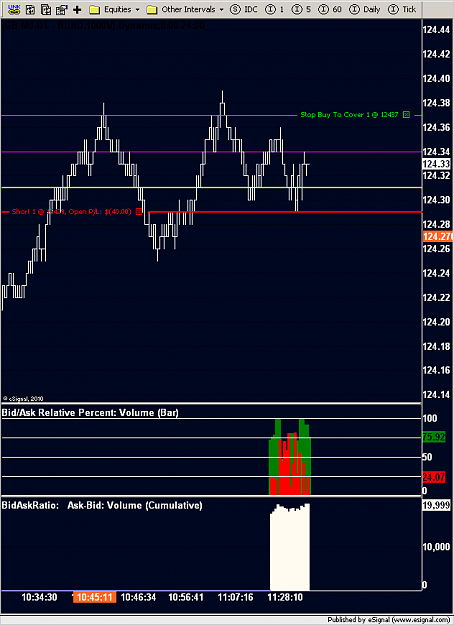
The support/resistance part is pretty self explanatory, so I'll concentrate on the lower timeframe (well, "volume" frame) stuff...
The lower TimeFrame (TF) will be used for entries only. We are going to concentrate on the swing highs and swing lows - we all know the Lower Low / Lower high idea, and it's for a change in this dynamic that gets us into a position. We seperate the Highs / Lows into a leading edge and a lagging edge. In a downtrend, the swing lows are the leading edge, and the swing highs are the lagging edge (and vice versa). If we don't get any clear indication of the bias from the price action, we define the price as rangebound and switch to a breakout strategy.
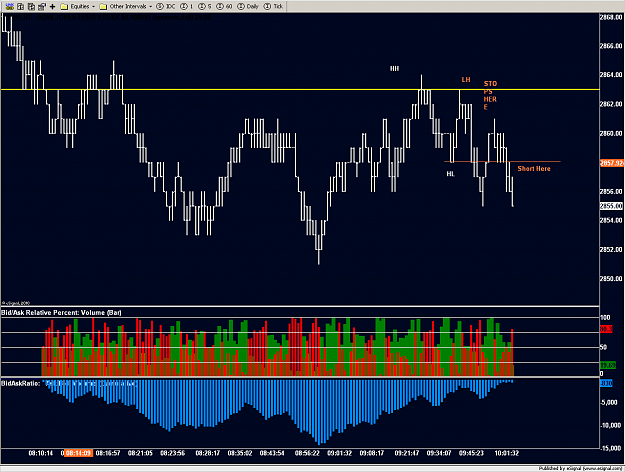
If you look at the " Long Entry" PDF, I have seperated it into three parts. The first part is what we look for in a trade off support (just reverse it all for shorts off resistance)...
1) Long entry
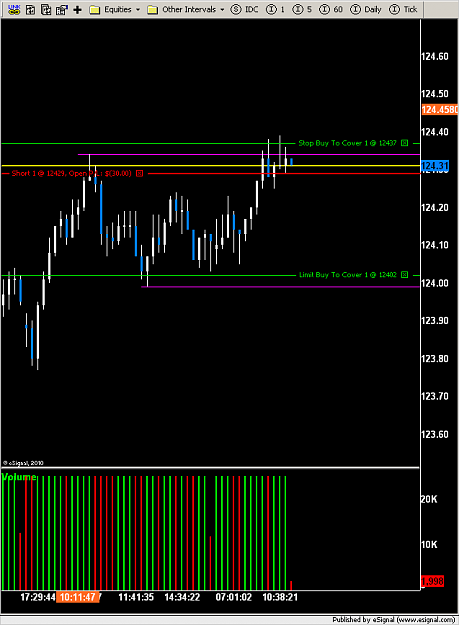
At support, we are set to "amber" once we get a weaker leading edge - in this case, a Higher Low. we then put orders in to trigger a trade long once we get a break of the lagging edge - in this case, a Higher High. The stop goes behind the Higher Low.
However, it doesn't always work like this, so we need to be prepared for chop...
2) Range Definition
If we are set to "amber" and waiting for the green light, but the Higher Low is breached (thereby setting a Lower Low), we pull the order and set the range as appropriate - we are then on the lookout for a...
3) Breakout Strategy
Once we have set a range, the next step is to wait for price to trade outside the range. If we trade above the range we look for longs, short if we trade below. We wait for a pullback after the breakout (so we know where to put our stop) and put an order in above the high / below the low.
One thing to note is that firstly, we are looking for a reversal - but if (by our definitions) price goes into a range, we can trade either long OR short.
Thats about it for entries.
EXITS
As I mentioned earlier, our lower TF is ONLY used for entries. In my experience, micro managing trades on a lower TF gets you out too early. My basic philosophy on lower time frames (however you define low) is that they are only useful some of the time; when you think there may be some signal because of the particular context of the wider market. If the current price isn't significant in term of market structure (i.e. at or near a particular support or resistance level) then everything on the lower TF is just noise generated by order flow.
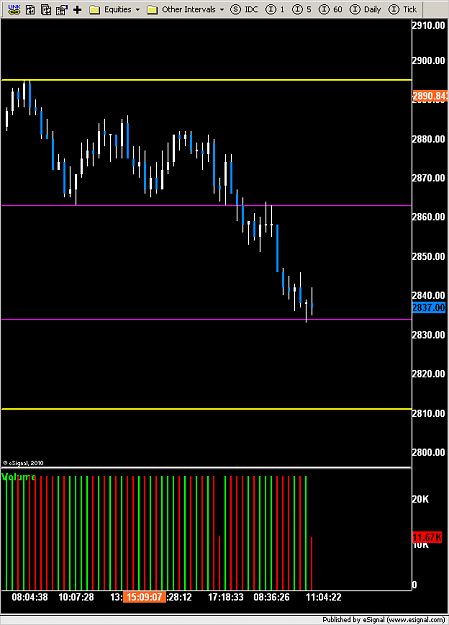
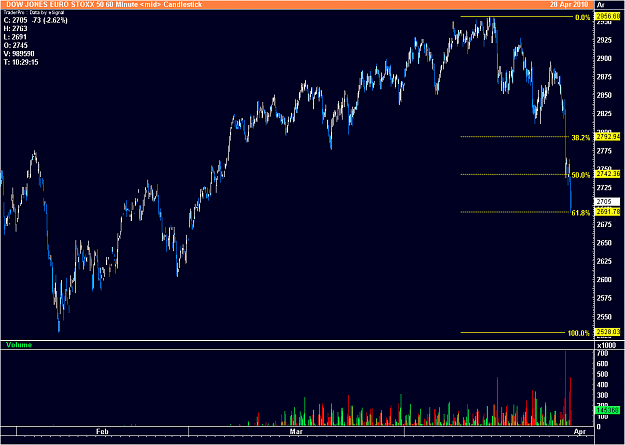
It follows, then, that our exits are managed on the Longer TF. Plain and simple, we look for the next significant level in the market, and set our targets a tick or two before it. Stops behind pullbacks, but only pullbacks on the higher TF, not the lower.
Example
The following example is from EUR/USD (I will try and post setups on the major intruments if and when I get the time, but I thought I'd post a forex one for you guys on my first post).
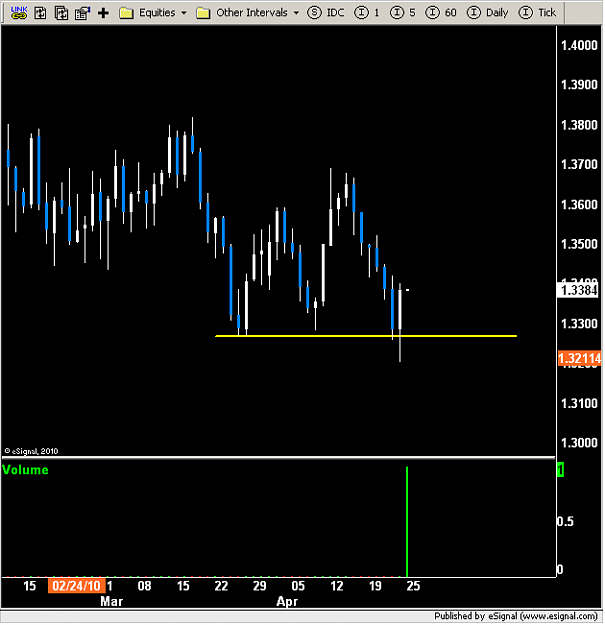
Firstly, we will have marked out the low of 25th March as a significant price in the market structure.
http://www.forexfactory.com/attachme...1&d=1272204362
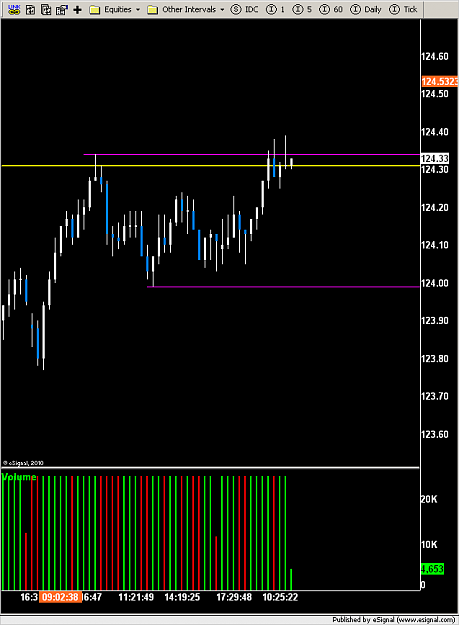
We then look at our lower TF (in this case, 60m) for an entry...
http://www.forexfactory.com/attachme...1&d=1272204362
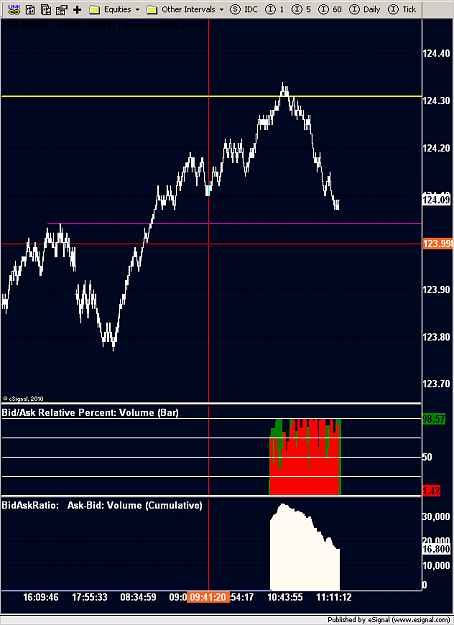
in this example, we see a long entry triggered by the sequence...
LL LH LL HH HL HH
The specifics are that we will have been LONG 1.3348 (one tick above the HH) with our stop below the Higher Low (so stop at 1.3264). Our exit order is placed just below the last swing high on the daily chart (remember we don't look at the lower TF for exits), which by my reckoning is at about 1.3680, making our exit order 1.3678. I've put it all on the 60m chart just for clarity to start things off.
http://www.forexfactory.com/attachme...1&d=1272204362
I'm pretty sure I will have left something out, so any questions just ask, and please feel free to comment!
Attached Image(s) (click to enlarge)
Attached File(s)