Matrixing the price is method using all time frames combined and finding from sturctural patterns the projected moves and price behaviour across all the time frames. Movie matrix explains matrix as everything that is around us, it is projected from the lowest possible matter up to the most complex system. Matrixing is not sci-fi concept, it was just used for that matter in movie, but in fact it exists in mathematics, nature (ecosystems, organs formed from tissues and cells and those being structured from atoms of different chemical elements), politics, markets and therefore price. Understanding that everything is a structure within structure is strong concept to understand movements in markets as it goes completly against the common 90% of trading mentality that no move can be logically/technically explained, one can only assume where price might react, which in fact is not correct. Every move can be traced down to its bare momentum shift by looking at proper structure, it is just about downscaling the TF deep enough. That does not mean that this gives 100% prediction of price movemenet, but it does give high probability of price target/reversal movements based on market/volume reactions and its patterns. Every large move starts from small move and its core reaction and then being built upwards with higher TFs.
Basics:
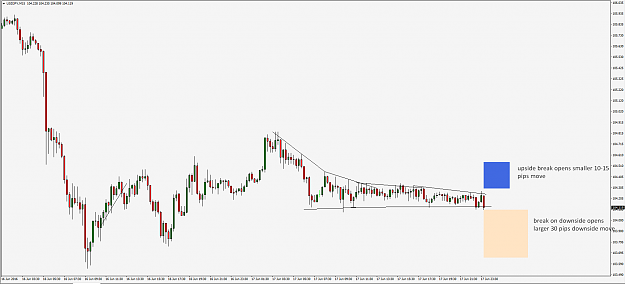
Two basics of pattern approach are Dow Jones theory of trend definition, along with trendline theory. Trendlines are always drawn from extreme high of a high or extreme low of a low not its middle/avarage rejection areas. This procedure helps to reduce entering on fake breakout. Trendlines and support/resistance together form structural patterns which have historically tested statistical behaviour that repeats up to high percentage, as the accumulated positions inside get squeezed to the oposite side until the supply and demand under extreme is balanced out again.
http://prntscr.com/bhx8z2
http://prntscr.com/bhxc0k
Rules of trading:
-Stop loss is being placed behind the low/high that initiated the break. This low/high is invalidation level if broken with close it invalidates the projected move. SUggested use for SL is to have manual close with use of alerts, this way fake breaks are averted by large.
-80% of whole structure height that connects to trendlines is used as target projection of TP, TP scaled to it is measuured from high/low break level not the trendline break level.
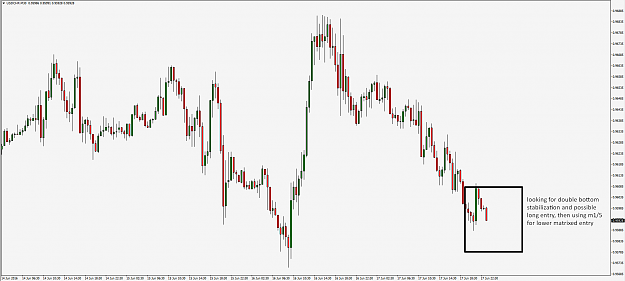
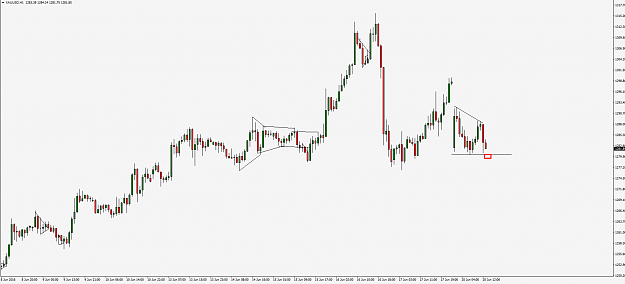
-many different structures can be used for entries such as channels, wedges, double bottoms/tops the important thing to follow is that there is always significant clear bottoming/topping attempt on them. That means for example a bear channel break is traded if there is double bottom placed before its break.
-Entries can be directly from single TF, or by using higher TF as leading pattern and then using lower TF for entry/risk (3 or more TFs lower for example h1+m1 combo)
-Use of break-even stop loss is suggested after price moves in favour of trade
-Every structure that you look needs decent amount of candles in it (20+), in order to spot precise breakout (and not be too late). That means trader should downscale TF to spot what is happening around key support or resistance area and its precise break point.
Combination setup higher TF + lower TF, increased RRR.
Example 1:
Higher TF: http://prntscr.com/bhxfhk
Lower TF: http://prntscr.com/bhxgk7
Example 2:
Higher TF: http://prntscr.com/bhxixk
Lower TF: http://prntscr.com/bhxlgu
Example 3:
Higher TF: http://prntscr.com/bhxoo1
Lower TF: http://prntscr.com/bhxr3v
Example 4:
Higher TF: http://prntscr.com/bhxsia
Lower TF: http://prntscr.com/bhxu45
Example 5:
Higher TF: http://prntscr.com/bhxuyl
Lower TF: http://prntscr.com/bhxwsw
Example 6:
Higher TF: http://prntscr.com/bhxyc2
Lower TF: http://prntscr.com/bhxzfz
Example 7:
HIgher TF: http://prntscr.com/bhyiv7
Lower TF: http://prntscr.com/bhyl3g
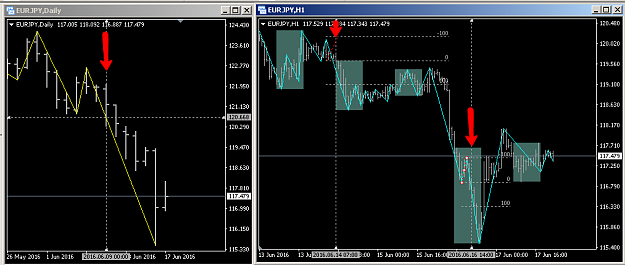
Cross TF structural matrixing. Projected moves of m1 m5 and m15 are represented with red rectangle for droping target, and blue with rising target move.
http://prntscr.com/bhydyj
http://prntscr.com/bhyf4l
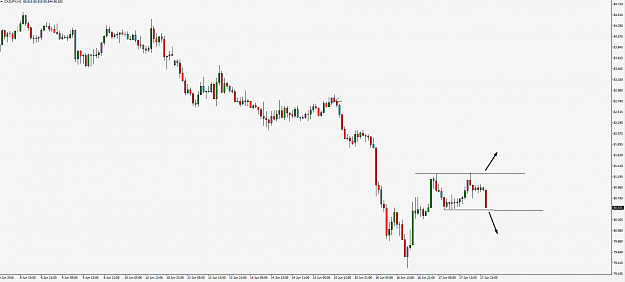
Price can move either up or down, the direction of its move can be tracked down into the core by matrixing the structures and time frames. In trend the price can form in fact only two types of structures, defining the most likely direction of price that is countinuation structure or reversal structure. There are many of structures that can fit into both cathegories but the important point is relationship of highs/lows in terms of previous trend. In down trend reversal structure needs to break highs to confirm reversal, and a countiuation structure needs highs to hold while support gives away. Oposite would apply to up trend.
Countinuation structures: http://prntscr.com/bi8i96
Reversal structures: http://prntscr.com/bi8jgj
Matrixing the whole day of price action on EURUSD, understanding the origins of moves, retraces and structural targeted moves. The method for matrixing is following the structures, if impulsive leg has no structural information, the principle is to downscale the time frame and find that structure, becouse structures always are present, at least on some time frame.
Example EU 9th June London open - Tokyo open:
M15: http://prntscr.com/bi8ned
M1: http://prntscr.com/bi8p4q
M1: http://prntscr.com/bi8r9q
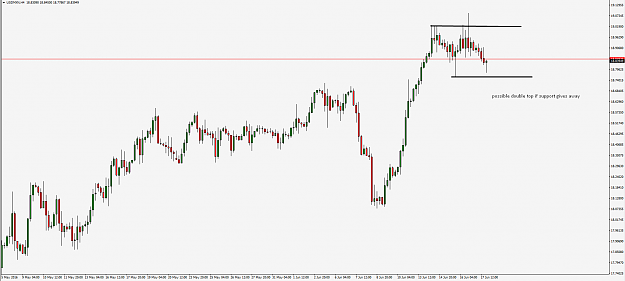
Matrixing the larger news move. Is there a top? Will the price retrace the move, or will it go further higher?:
M15: http://prntscr.com/bi8t68
M1: http://prntscr.com/bi8uh9
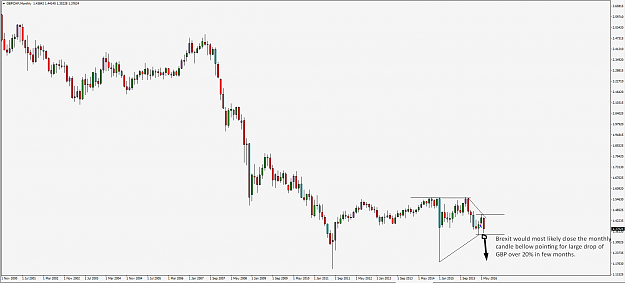
Matrixing large currency moves and their baked moves even before the key macro events are happening:
EU Monthly: http://prntscr.com/bi8vvs
USDRUB Monthly: http://prntscr.com/bi8wzt
AUDNZD Monthly: http://prntscr.com/bi8xq7
CAD Monthly: http://prntscr.com/bi8ysa
ZAR Monthly: http://prntscr.com/bi90ex
Gold/USD Monthly: http://prntscr.com/bi92ph
JPY Monthly: http://prntscr.com/bi93sw
Basics:
Two basics of pattern approach are Dow Jones theory of trend definition, along with trendline theory. Trendlines are always drawn from extreme high of a high or extreme low of a low not its middle/avarage rejection areas. This procedure helps to reduce entering on fake breakout. Trendlines and support/resistance together form structural patterns which have historically tested statistical behaviour that repeats up to high percentage, as the accumulated positions inside get squeezed to the oposite side until the supply and demand under extreme is balanced out again.
http://prntscr.com/bhx8z2
http://prntscr.com/bhxc0k
Rules of trading:
-Stop loss is being placed behind the low/high that initiated the break. This low/high is invalidation level if broken with close it invalidates the projected move. SUggested use for SL is to have manual close with use of alerts, this way fake breaks are averted by large.
-80% of whole structure height that connects to trendlines is used as target projection of TP, TP scaled to it is measuured from high/low break level not the trendline break level.
-many different structures can be used for entries such as channels, wedges, double bottoms/tops the important thing to follow is that there is always significant clear bottoming/topping attempt on them. That means for example a bear channel break is traded if there is double bottom placed before its break.
-Entries can be directly from single TF, or by using higher TF as leading pattern and then using lower TF for entry/risk (3 or more TFs lower for example h1+m1 combo)
-Use of break-even stop loss is suggested after price moves in favour of trade
-Every structure that you look needs decent amount of candles in it (20+), in order to spot precise breakout (and not be too late). That means trader should downscale TF to spot what is happening around key support or resistance area and its precise break point.
Combination setup higher TF + lower TF, increased RRR.
Example 1:
Higher TF: http://prntscr.com/bhxfhk
Lower TF: http://prntscr.com/bhxgk7
Example 2:
Higher TF: http://prntscr.com/bhxixk
Lower TF: http://prntscr.com/bhxlgu
Example 3:
Higher TF: http://prntscr.com/bhxoo1
Lower TF: http://prntscr.com/bhxr3v
Example 4:
Higher TF: http://prntscr.com/bhxsia
Lower TF: http://prntscr.com/bhxu45
Example 5:
Higher TF: http://prntscr.com/bhxuyl
Lower TF: http://prntscr.com/bhxwsw
Example 6:
Higher TF: http://prntscr.com/bhxyc2
Lower TF: http://prntscr.com/bhxzfz
Example 7:
HIgher TF: http://prntscr.com/bhyiv7
Lower TF: http://prntscr.com/bhyl3g
Cross TF structural matrixing. Projected moves of m1 m5 and m15 are represented with red rectangle for droping target, and blue with rising target move.
http://prntscr.com/bhydyj
http://prntscr.com/bhyf4l
Price can move either up or down, the direction of its move can be tracked down into the core by matrixing the structures and time frames. In trend the price can form in fact only two types of structures, defining the most likely direction of price that is countinuation structure or reversal structure. There are many of structures that can fit into both cathegories but the important point is relationship of highs/lows in terms of previous trend. In down trend reversal structure needs to break highs to confirm reversal, and a countiuation structure needs highs to hold while support gives away. Oposite would apply to up trend.
Countinuation structures: http://prntscr.com/bi8i96
Reversal structures: http://prntscr.com/bi8jgj
Matrixing the whole day of price action on EURUSD, understanding the origins of moves, retraces and structural targeted moves. The method for matrixing is following the structures, if impulsive leg has no structural information, the principle is to downscale the time frame and find that structure, becouse structures always are present, at least on some time frame.
Example EU 9th June London open - Tokyo open:
M15: http://prntscr.com/bi8ned
M1: http://prntscr.com/bi8p4q
M1: http://prntscr.com/bi8r9q
Matrixing the larger news move. Is there a top? Will the price retrace the move, or will it go further higher?:
M15: http://prntscr.com/bi8t68
M1: http://prntscr.com/bi8uh9
Matrixing large currency moves and their baked moves even before the key macro events are happening:
EU Monthly: http://prntscr.com/bi8vvs
USDRUB Monthly: http://prntscr.com/bi8wzt
AUDNZD Monthly: http://prntscr.com/bi8xq7
CAD Monthly: http://prntscr.com/bi8ysa
ZAR Monthly: http://prntscr.com/bi90ex
Gold/USD Monthly: http://prntscr.com/bi92ph
JPY Monthly: http://prntscr.com/bi93sw