Hello. I have had great success manually trading off Gartley patterns -> http://www.forexfactory.com/showthread.php?t=238643
Originally written in 1935 -> http://books.google.com/books?id=sZ3...page&q&f=false
The original Gartley system didn't use fibonaccis. I think someone in the 70's wrote a book about using the patterns with Fibs, this is the modern method. I will lookup the author.
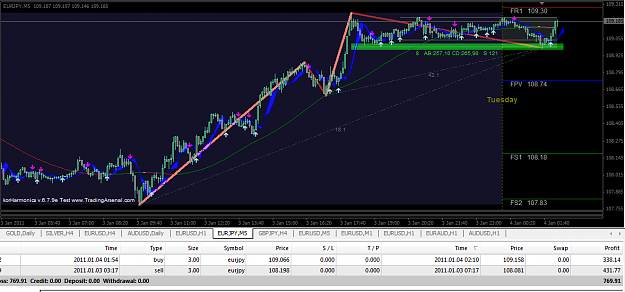
On this one, green rectangle on both 1 minute and 5 minute chart. quick profit.
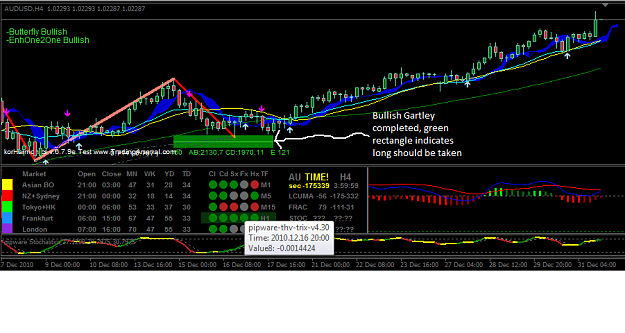
The attached indicator draws either a bullish (green) or bearish (red) support or resistance rectangle under or above the price. This is the time to enter a position either long or short. It is very accurate from what I've read it's at least 70% accurate. In my experience it's a lot better than that.
But in terms of creating the EA, I only have the EX4 file not the source. Am aware that iCustom can be used to read indicator output. This is some iCustom code for another indicator. However, with the korharmonics indicator I do not see any values in the data window when the rectangle is drawn. If someone can help me understand how to test if it is there or not that would be awesome.
{ copyrighted attachment deleted by staff }
Originally written in 1935 -> http://books.google.com/books?id=sZ3...page&q&f=false
The original Gartley system didn't use fibonaccis. I think someone in the 70's wrote a book about using the patterns with Fibs, this is the modern method. I will lookup the author.
Attached Image (click to enlarge)
Attached Image (click to enlarge)
On this one, green rectangle on both 1 minute and 5 minute chart. quick profit.
The attached indicator draws either a bullish (green) or bearish (red) support or resistance rectangle under or above the price. This is the time to enter a position either long or short. It is very accurate from what I've read it's at least 70% accurate. In my experience it's a lot better than that.
But in terms of creating the EA, I only have the EX4 file not the source. Am aware that iCustom can be used to read indicator output. This is some iCustom code for another indicator. However, with the korharmonics indicator I do not see any values in the data window when the rectangle is drawn. If someone can help me understand how to test if it is there or not that would be awesome.
Inserted Code
if((iCustom(Symbol(),0,"HG_0001a_MTF",1.0,5,15,30,60,0,1)>0) ||
          (iCustom(Symbol(),0,"HG_0001a_MTF",1.0,5,15,30,60,2,1)>0) ||
          (iCustom(Symbol(),0,"HG_0001a_MTF",1.0,5,15,30,60,4,1)>0) ||
          (iCustom(Symbol(),0,"HG_0001a_MTF",1.0,5,15,30,60,6,1)>0) ||
          (iCustom(Symbol(),0,"Trend Magic",50,5,1,1)<iCustom(Symbol(),0,"Trend Magic",50,5,0,1)) )
       //--
        if(iCustom(Symbol(),0,"Trend Magic",50,5,0,0)<iCustom(Symbol(),0,"Trend Magic",50,5,1,0))
          if(TOOC()==0 && trade_bar<Bars)
           {
            OrderSend(Symbol(),OP_BUY,LotSize,Ask,250,Bid-StopLoss*Point,0,NULL,0,0,Aqua);
            trade_bar=Bars;
           }
{ copyrighted attachment deleted by staff }
