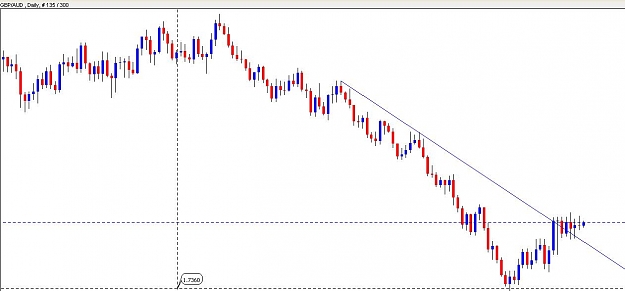
in range you will bounce around in a 2 octave band , that is what we are doing right now
Ignored
Hey malc, got a present for you, I always really liked your rule "long only > H1_14LWMA && short only < H1_14LWMA" but I really hated to keep going back and forth on the hourly chart to M5/15 when scalping. We both know 14*4=M15_56LWMA does not do the same job!
A friendly trader pointed out this indi to me and for me it does the perfect job of keeping on the correct side of the trend.
T. Henning Murrey is one of the world's most innovative mathematical geniuses...
Gann was the man: 1920 to 1954.... Now Murrey is the man: 1992- 2007 forward 15.625 years so far. You don't have to know the math, just follow his rules to trade for profits against small risk.
Murrey "invented" The MurreyMath Program in 1993 to make trading easy & predictable for anyone.
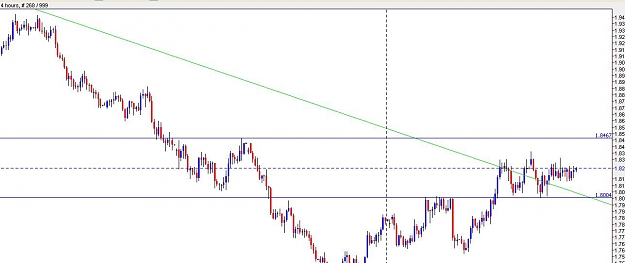
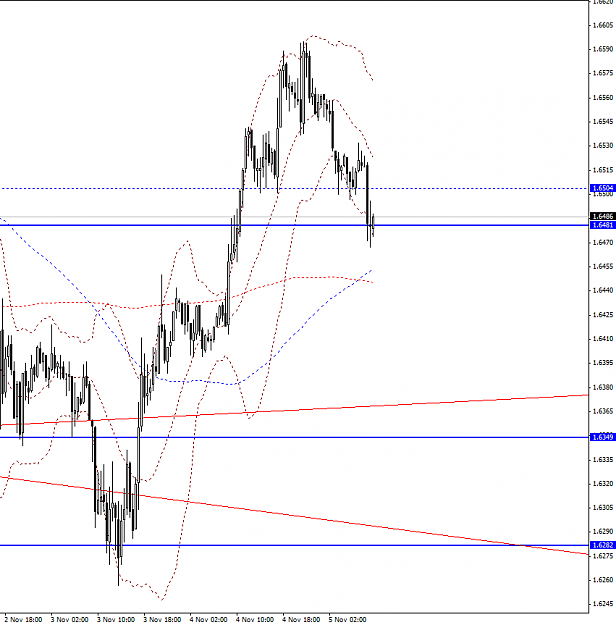
I noticed some posts earlier about multiple time frame MAs for helping stay in a trend. This is one of my 15 min charts using the much watched hourly 20 ema - on this TF its obviously the 80 ema.
Also I'm showing the NTR / ATR stop indy which responds to changes in volatility and also puts the stop value in the top right hand corner.
Daily Pivots and Sweet Spots provide potential S / R levels - again these are the most widely used of all price level indicators and give great areas to work off.....
I am curious to know among those of you using the market statistics indi, what time frame do you use ? ie start date/time and end date/time.
Thank you
Ignored
Hi - I guess that you're talking about this type of indy.....if so, I and others have discussed it in Shamus's VSA thread...drop by and see if the posts there help.....
I noticed some posts earlier about multiple time frame MAs for helping stay in a trend. This is one of my 15 min charts using the much watched hourly 20 ema - on this TF its obviously the 80 ema.
Also I'm showing the NTR / ATR stop indy which responds to changes in volatility and also puts the stop value in the top right hand corner.
Daily Pivots and Sweet Spots provide potential S / R levels - again these are the most widely used of all price level indicators and give great areas to work off.....
NP - here it is - you can set the ATR and the coeficient - just experiment and then check back over a few weeks. Also, you will notice that its values are time frame sensitive.....