The 212 Candle Pattern is something i have come across recently. I'm sure there is other people who use the same formation, but as far as i'm aware i'm the first person to actually publicly talk about it. The candle pattern aim is to predict the next bar, not the next 2, 3 or 5 but only the next bar. This especially works well on the Hour 4 chart or Daily.
Aim: To predict the next bar
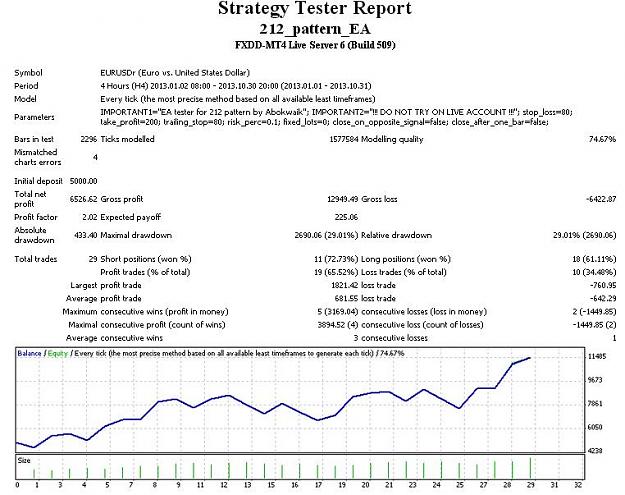
Success Rate: After backtesting (You can do this too) you will find a high ammount of probable trades. After i tested around 100 of these patterns it was successful at predicting the next bar 70% of the time.
Most traders try and make trading systems difficult, but in fact trading can be as simple as you make it.
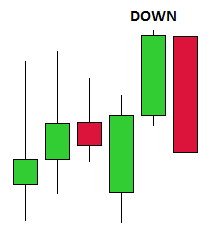
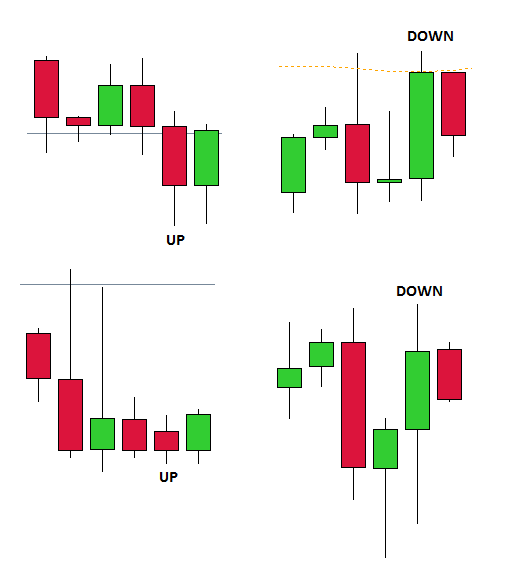
The Name: The name of the pattern is basically what it says on the tin. 2 Bull or Bear candles followed by an opposite candle, then followed by 2 more Bull or Bear candles depending whether you're buying or selling. For instance, in an up trend you want to spot two bull candles followed by a bear candle followed by two more bull candles. After seeing this formation you can be confident that the fifth candle will be bearish.

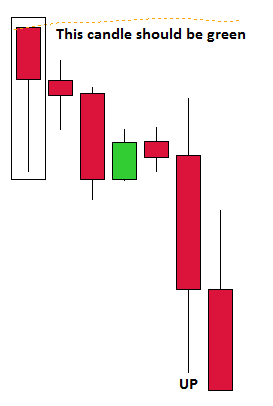
Here is another example of a trade.
Why does this pattern work?
This pattern seems to work well as a pull back system. The candles show indecision in the market and a war between both bulls and bears. A retracement already happened once after the first two candles and that's why we hope history will repeat its self again.
Example of a bad trade:

Another bad trade
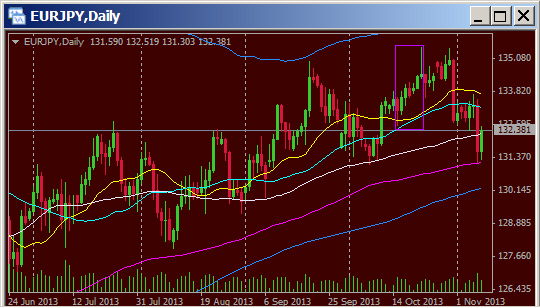
Examples of Good trades which work well. To identify the trend try to use a 50 EMA or 20 EMA to filter the signals. Also note that we're only predicting the next bar, not the next 3,4 or 5 bars. Don't be greedy.
Timeframe: H4, Daily, Weekly, Monthly
Stop / Take Profit: Haven't worked this out yet
Aim: To predict the next bar
Success Rate: After backtesting (You can do this too) you will find a high ammount of probable trades. After i tested around 100 of these patterns it was successful at predicting the next bar 70% of the time.
Most traders try and make trading systems difficult, but in fact trading can be as simple as you make it.
The Name: The name of the pattern is basically what it says on the tin. 2 Bull or Bear candles followed by an opposite candle, then followed by 2 more Bull or Bear candles depending whether you're buying or selling. For instance, in an up trend you want to spot two bull candles followed by a bear candle followed by two more bull candles. After seeing this formation you can be confident that the fifth candle will be bearish.
Attached Image
Here is another example of a trade.
Attached Image
Why does this pattern work?
This pattern seems to work well as a pull back system. The candles show indecision in the market and a war between both bulls and bears. A retracement already happened once after the first two candles and that's why we hope history will repeat its self again.
Example of a bad trade:
Attached Image
Another bad trade
Attached Image
Examples of Good trades which work well. To identify the trend try to use a 50 EMA or 20 EMA to filter the signals. Also note that we're only predicting the next bar, not the next 3,4 or 5 bars. Don't be greedy.
Attached Image
Timeframe: H4, Daily, Weekly, Monthly
Stop / Take Profit: Haven't worked this out yet