Thank you. Ok so AB=CD is only if the price goes to and closes between 0.618-0.786AB. If it goes above or below it is the ABCD pattern.
What happens if the retracement goes to 38.2 and goes up slightly and then moves down between .500 and 0.618. Should I redraw my fib extension or leave it?
Thanks a lot.
P.S. Dibo90 - I did watch his videos but got only more confused. I guess he just moves too quickly for me and it all got mixed up big time. But I will definitely watch them all again a few more times.
DislikedIn the methods used by Mr. Pip (i.e. this thread), the 'ABCD' is a particular AB=CD formation whereby C retraces to 0.618-0.786AB.
If that particular criteria isn't met, it may still be an AB=CD but it is not an 'ABCD'
That's it in a nutshell (I think)Ignored
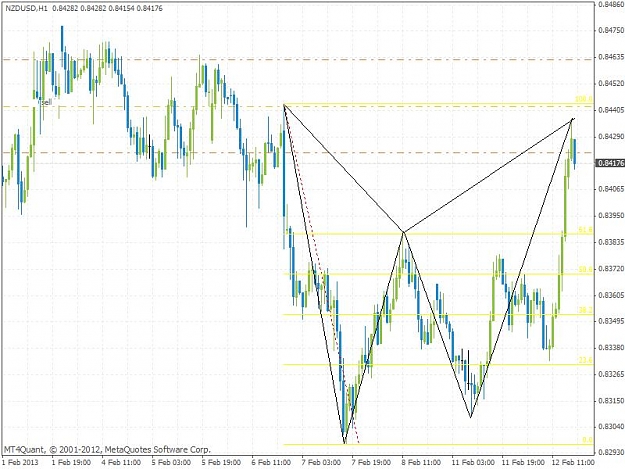
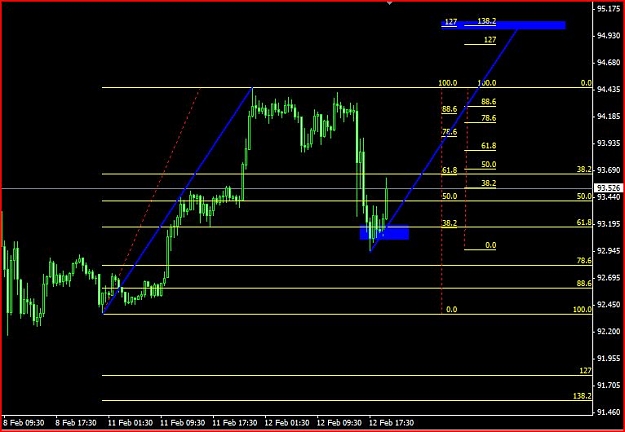
Attached Image (click to enlarge)