This is a system that I have been playing around with the last few days that looks good.
It uses Tom DeMark's TD lines.
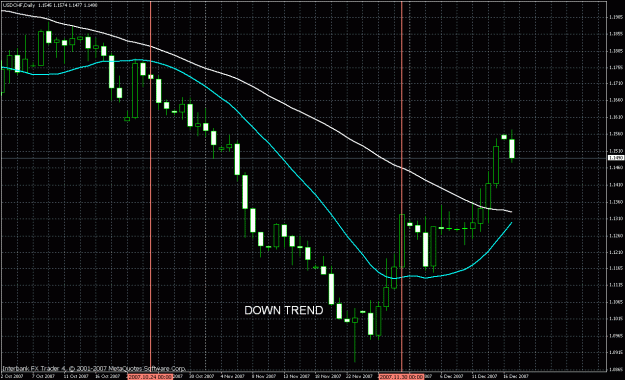
The below is for USD/CHF. All of the majors look similar on a chart, although I have not tested them.
During the last tradable period, it had:
20 W @ 20 pips each
3 L @ 30 pips each
1 L @ 11 pips
1 L @ 14 pips
Risking 2% per trade, this would have grown an account by 20%. It would be more than that if you factor in the effect of compounding.
This was between 10/25/07 and 12/02/07
This was a very trending period.
I went back and tried to find the ugliest period I could.
I settled on July and August of 2006.
It lost a total of 4 pips during that period.
This would have depleted your account by 1.5%
The inspitration came from JohnW's method which can be found in this post:
http://www.forexfactory.com/showpost...&postcount=241
I'm not using anything he's using and John's method has a lot of discretion. I've tried to make this one 100% mechanical. Because of that, I'm sure John's method has a lot more potential than this one does.
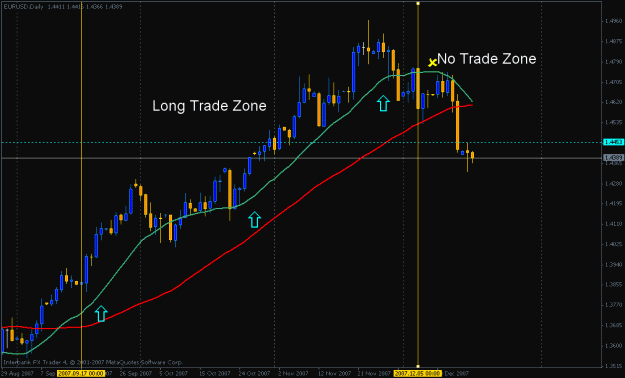
1. ESTABLISHING THE DAILY TREND
Plot a 48 SMA and an 18 SMA on the daily chart.
UP TREND = The 18 is above the 48 and both are sloping upward.
DOWN TREND = The 18 is below the 48 and both are sloping downward.
If yesterday, the daily chart showed an up trend, then today we will only enter long trades.
If yesterday, the daily chart showed a down trend, then today we will only enter short trades.
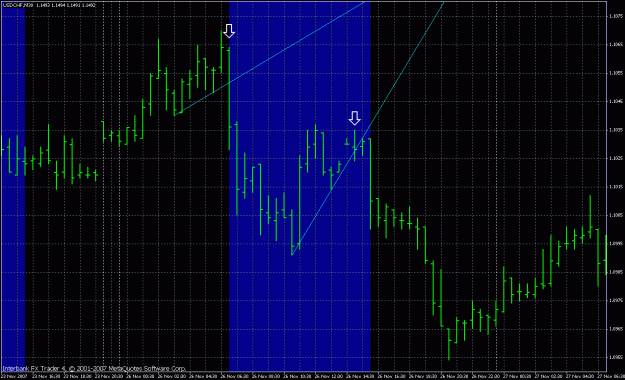
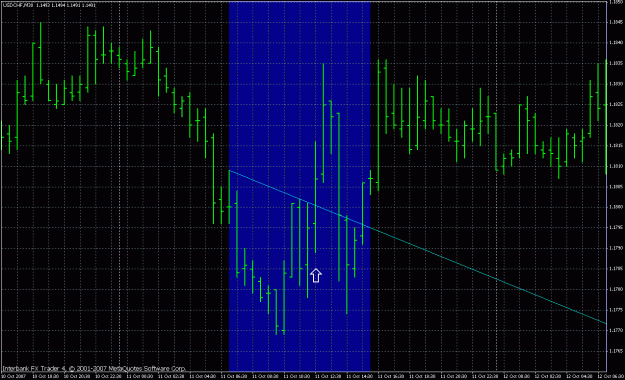
All entries are made on the 30M chart.
ENTERING THE TRADE
Use the 30M chart only.
Place trades only from 0800 UK time until 1700 UK time.
LONG
Enter long on a 2 pip break of a downward sloping TD (level one) trendline. This break must occur during our trade time.
TP 20
SL 30
Let the trade run until either the TP or SL is hit. On Fridays, close out any open trades at market close.
SHORT
Enter short on a 2 pip break of an upward sloping TD (level one) trendline. This break must occur during our trade time.
TP 20
SL 30
Let the trade run until either the TP or SL is hit. On Fridays, close out any open trades at market close.
I'll post a few examples and then I have to go. I just learned I have an illness in the family.
If you know TD lines, then I think I've explained all you need to know.
If you don't know how to draw them, you can find instructions in the internet. Maybe someone can explain them while I'm gone. I'll do my best to answer questions when I return.
I'm sure this method can be improved, especially the daily trend determination.
It uses Tom DeMark's TD lines.
The below is for USD/CHF. All of the majors look similar on a chart, although I have not tested them.
During the last tradable period, it had:
20 W @ 20 pips each
3 L @ 30 pips each
1 L @ 11 pips
1 L @ 14 pips
Risking 2% per trade, this would have grown an account by 20%. It would be more than that if you factor in the effect of compounding.
This was between 10/25/07 and 12/02/07
This was a very trending period.
I went back and tried to find the ugliest period I could.
I settled on July and August of 2006.
It lost a total of 4 pips during that period.
This would have depleted your account by 1.5%
The inspitration came from JohnW's method which can be found in this post:
http://www.forexfactory.com/showpost...&postcount=241
I'm not using anything he's using and John's method has a lot of discretion. I've tried to make this one 100% mechanical. Because of that, I'm sure John's method has a lot more potential than this one does.
1. ESTABLISHING THE DAILY TREND
Plot a 48 SMA and an 18 SMA on the daily chart.
UP TREND = The 18 is above the 48 and both are sloping upward.
DOWN TREND = The 18 is below the 48 and both are sloping downward.
If yesterday, the daily chart showed an up trend, then today we will only enter long trades.
If yesterday, the daily chart showed a down trend, then today we will only enter short trades.
All entries are made on the 30M chart.
ENTERING THE TRADE
Use the 30M chart only.
Place trades only from 0800 UK time until 1700 UK time.
LONG
Enter long on a 2 pip break of a downward sloping TD (level one) trendline. This break must occur during our trade time.
TP 20
SL 30
Let the trade run until either the TP or SL is hit. On Fridays, close out any open trades at market close.
SHORT
Enter short on a 2 pip break of an upward sloping TD (level one) trendline. This break must occur during our trade time.
TP 20
SL 30
Let the trade run until either the TP or SL is hit. On Fridays, close out any open trades at market close.
I'll post a few examples and then I have to go. I just learned I have an illness in the family.
If you know TD lines, then I think I've explained all you need to know.
If you don't know how to draw them, you can find instructions in the internet. Maybe someone can explain them while I'm gone. I'll do my best to answer questions when I return.
I'm sure this method can be improved, especially the daily trend determination.
Attached Image(s) (click to enlarge)