First off thanks to Bemac and all the other great contributors of this thread. I've been reading through this thread the past few weeks while placing demo trades using the grid ICCE indi. The ICCE indi's ability to display future levels of support on resistance is amazing! Now if I could just figure out the best way to trade these levels...
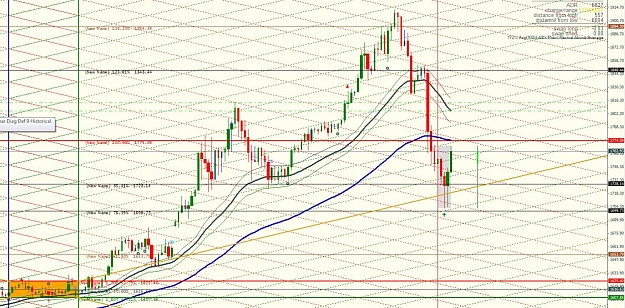
I was setting the indi up on some new charts just now and came across this one for the S&P 500. Like aserbfx sometimes says, "Voodoo". When a wild day in the stock market like yesterday shows respect like this at two of the levels and then follows it up today with a picture perfect doji on an ICCE level it makes you think that there just might be something to these ICCE levels???
If I see a break of today's doji high I'll probably be placing a demo buy with a target at the bottom of the ICCE box which is 1256. The 1256 level also happens to be the 50% retracement of the current down move from 1354. 
I was setting the indi up on some new charts just now and came across this one for the S&P 500. Like aserbfx sometimes says, "Voodoo". When a wild day in the stock market like yesterday shows respect like this at two of the levels and then follows it up today with a picture perfect doji on an ICCE level it makes you think that there just might be something to these ICCE levels???
If I see a break of today's doji high I'll probably be placing a demo buy with a target at the bottom of the ICCE box which is 1256. The 1256 level also happens to be the 50% retracement of the current down move from 1354.
Attached Image (click to enlarge)