Introduction
Hi!
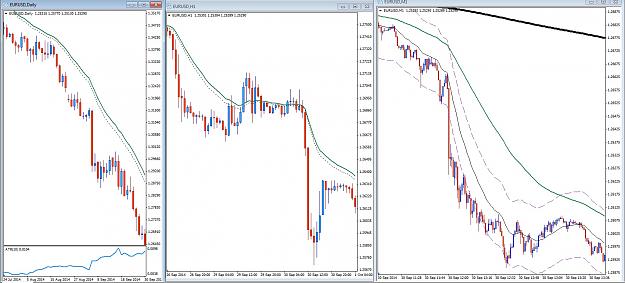
First of all i going to give you an introduction to the concepts i use. After that we are going to look at some picture examples of these principles in action. This is a systematic way to understand price, in particular EUR/USD, but it is a very general approach to understanding the price movements of currency pairs. This way of thinking about price consists of three principles: price action, support and resistance and price balance and three timeframes: D1, H1 and M1.
Price action
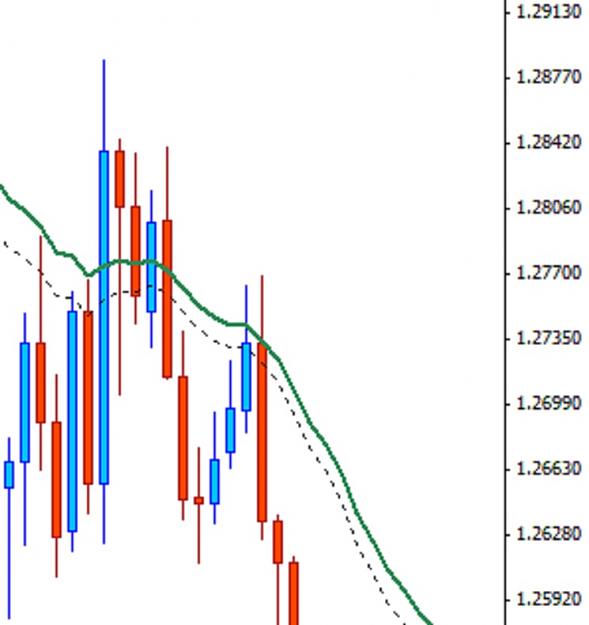
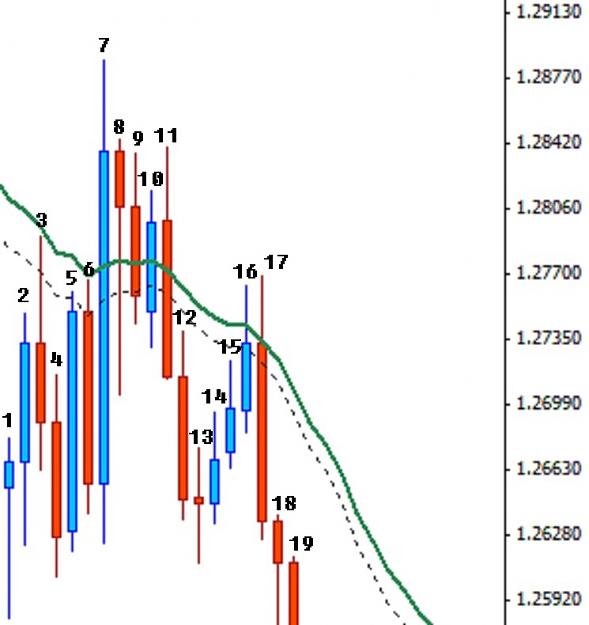
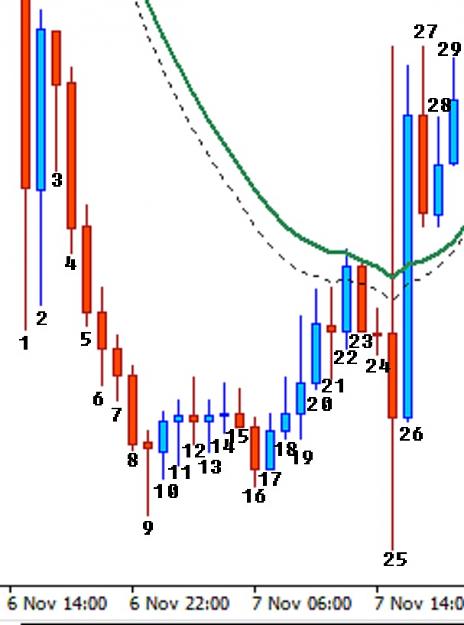
Most important and the principle from which the other two derives is price action. I choose to define "price action" as the pattern of the recent historical candles. The price action tells us how fast price is changing, in what direction and it also defines the trend.
Support and resistance
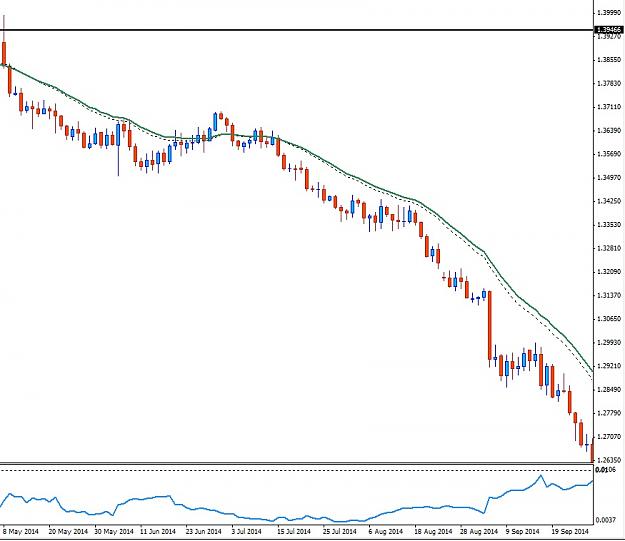
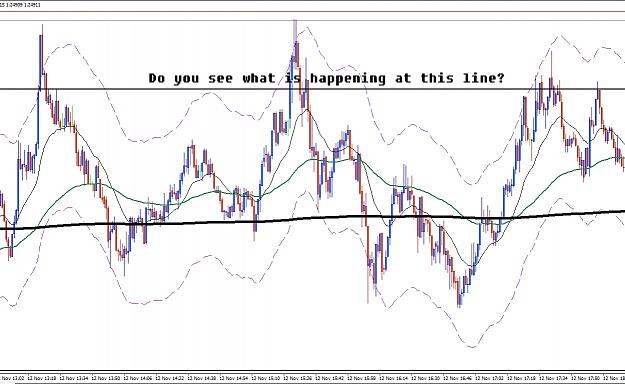
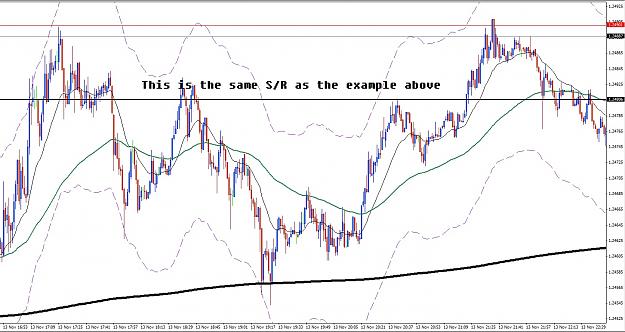
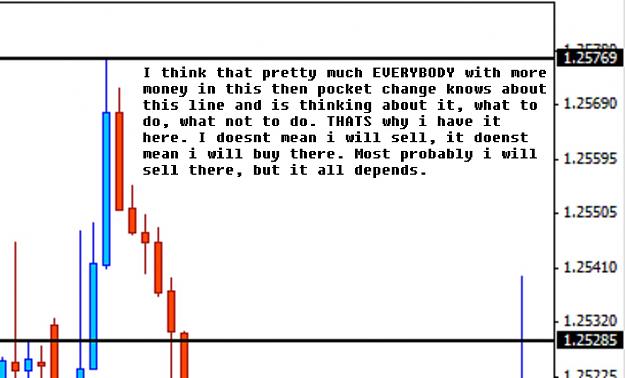
The second principle is support and resistance. The price action tells us also about the existence of support and resistance. Support and resistance is orders of relevant total volume that are being filled at a particular level of price.
Price balance
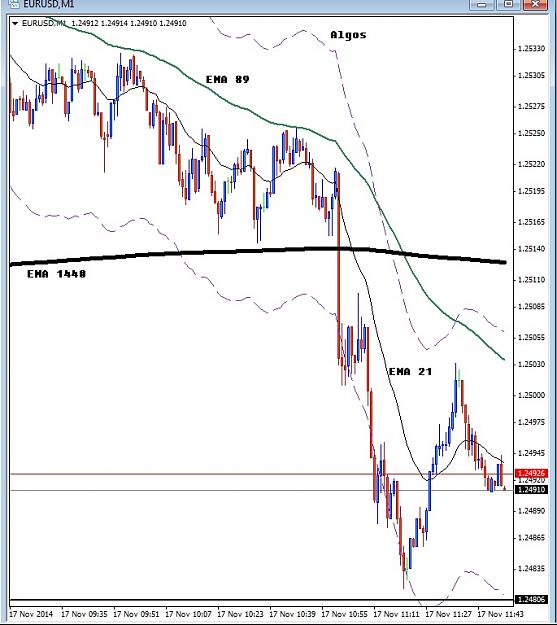
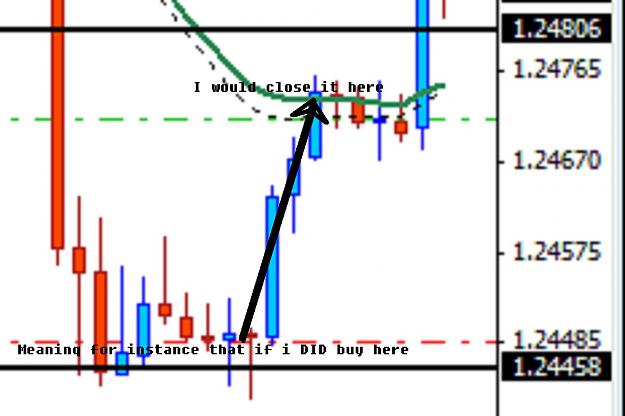
The third principle is the balance of price. Every time price touches or gets very close to a certain level that i define as the daily exponential average. Of the avaliable timeframes, this is most clearly defined on M1 and it is the period 1440 exponential moving average.
To analyze price i use D1, H1 and M1 timeframes for various good reasons.
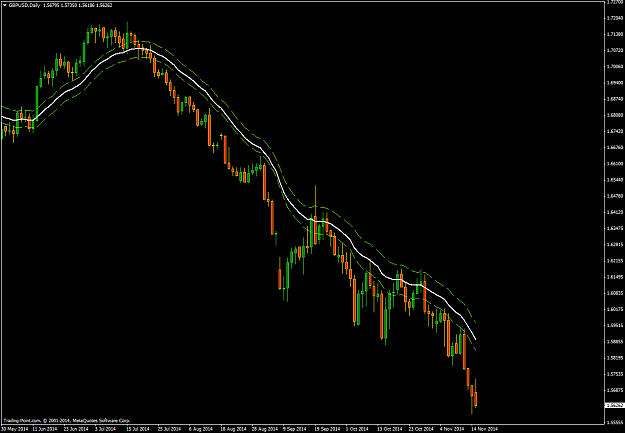
D1
D1 is used to determine the general price bias. What this is ment to do is to determine if it is easier, safer and more profitable to sell or to buy. D1 is ment to do this and not anything else. In analyzing this there is ALWAYS a bias, and this is its main purpose.
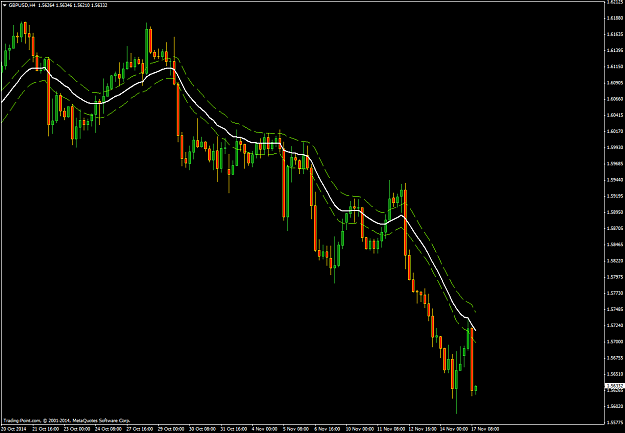
H1
H1 is used to determine current intraday trend and most other things. H1 should be enough to trade alone without the other timeframes, but the other two has their advantages. Perhaps to a beginner, it is best only to focus on H1 if it seems to much information to analyze to use all three.
M1
M1 is used to define support and resistance and to define the exact, best entries and exits.
This way of thinking and analyzing price is flexible, and perhaps not so good for beginners in forex. There are no fixed and certain ways to enter or exit. There are not exact stoploss and no exact take profits. Why? Because these things depend personal preference and the way in which you are most comfortable to trade. There is no ONE correct way to trade. This is simply something you have to find out for yourself.
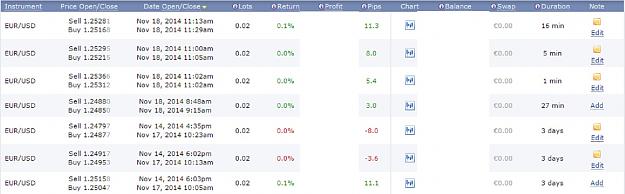
Personally i dont use stoplosses and i very seldom use the take profits i set. Instead i use small lots and i trade every day, so mostly i monitor my trades all day during London open. This is because as price changes, i must adapt to its changes to be profitable. If price seem to stall near my take profits, i close it in less profit then otherwise. Sometimes i close an open position in a loss if i see that i was totally wrong. I dont have any fixed numbers to determine this, those actions are based on the current changes of price.
Hi!
First of all i going to give you an introduction to the concepts i use. After that we are going to look at some picture examples of these principles in action. This is a systematic way to understand price, in particular EUR/USD, but it is a very general approach to understanding the price movements of currency pairs. This way of thinking about price consists of three principles: price action, support and resistance and price balance and three timeframes: D1, H1 and M1.
Price action
Most important and the principle from which the other two derives is price action. I choose to define "price action" as the pattern of the recent historical candles. The price action tells us how fast price is changing, in what direction and it also defines the trend.
Support and resistance
The second principle is support and resistance. The price action tells us also about the existence of support and resistance. Support and resistance is orders of relevant total volume that are being filled at a particular level of price.
Price balance
The third principle is the balance of price. Every time price touches or gets very close to a certain level that i define as the daily exponential average. Of the avaliable timeframes, this is most clearly defined on M1 and it is the period 1440 exponential moving average.
To analyze price i use D1, H1 and M1 timeframes for various good reasons.
D1
D1 is used to determine the general price bias. What this is ment to do is to determine if it is easier, safer and more profitable to sell or to buy. D1 is ment to do this and not anything else. In analyzing this there is ALWAYS a bias, and this is its main purpose.
H1
H1 is used to determine current intraday trend and most other things. H1 should be enough to trade alone without the other timeframes, but the other two has their advantages. Perhaps to a beginner, it is best only to focus on H1 if it seems to much information to analyze to use all three.
M1
M1 is used to define support and resistance and to define the exact, best entries and exits.
This way of thinking and analyzing price is flexible, and perhaps not so good for beginners in forex. There are no fixed and certain ways to enter or exit. There are not exact stoploss and no exact take profits. Why? Because these things depend personal preference and the way in which you are most comfortable to trade. There is no ONE correct way to trade. This is simply something you have to find out for yourself.
Personally i dont use stoplosses and i very seldom use the take profits i set. Instead i use small lots and i trade every day, so mostly i monitor my trades all day during London open. This is because as price changes, i must adapt to its changes to be profitable. If price seem to stall near my take profits, i close it in less profit then otherwise. Sometimes i close an open position in a loss if i see that i was totally wrong. I dont have any fixed numbers to determine this, those actions are based on the current changes of price.
My signature is: "Classified".