Three step method:
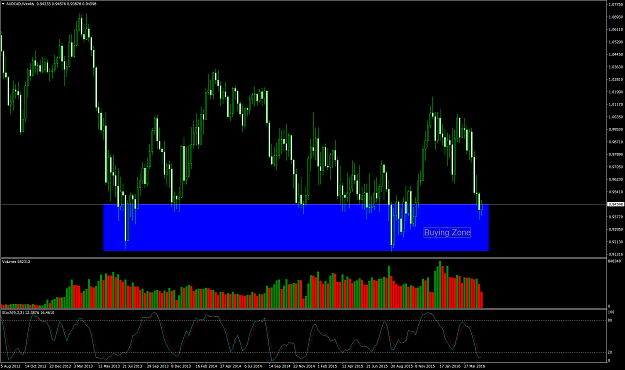
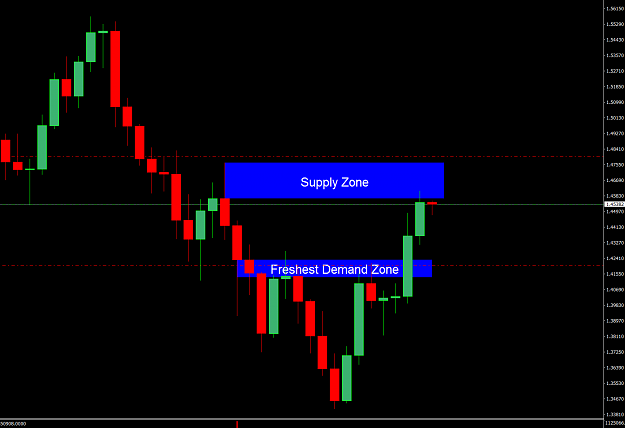
STEP 1: Start looking at the weeklies for the 10, 000 feet view of the opportunity. Be like an American eagle and spot your prey from far above before making your move. Three kinds of preys are available for me:
- Supply Zones
- Demand Zones
- Horizontal s/r levels and/or trend lines
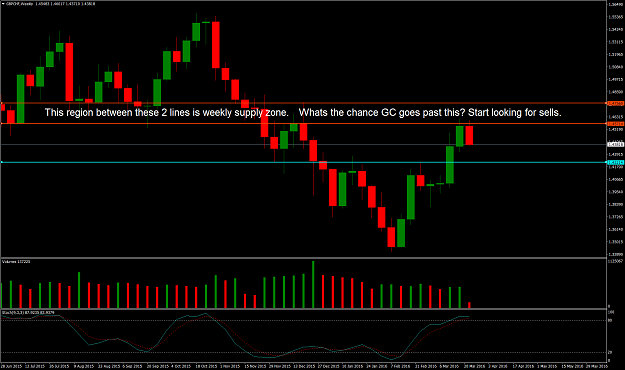
See the image for GBPCHF short I took recently for a weekly analysis of running into supply.
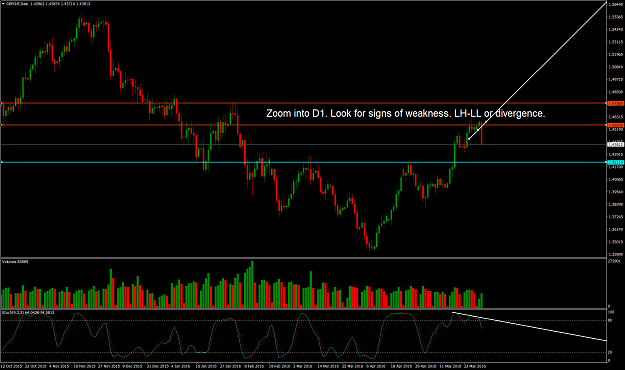
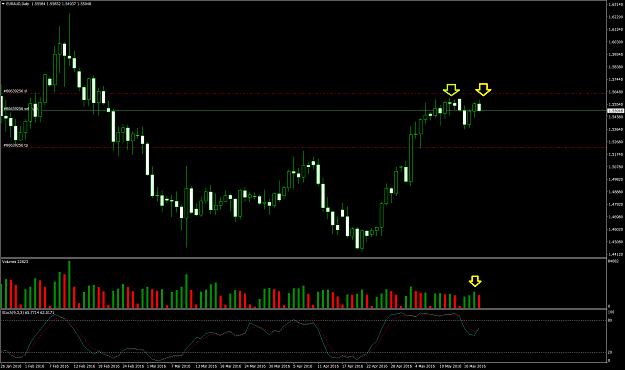
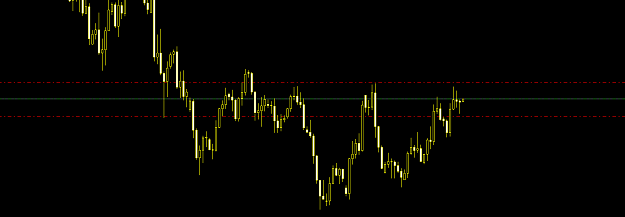
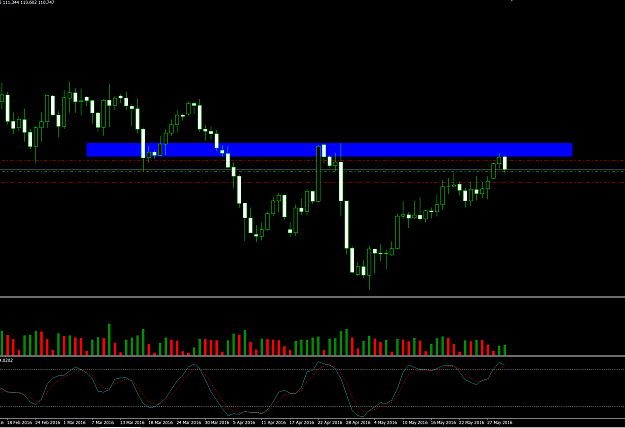
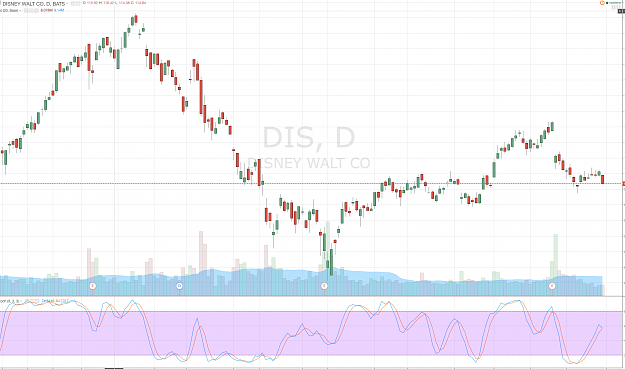
STEP 2: On the daily time frame, I want to look for signs of weakness if I am selling. Signs include making lower high, lower lows. I look for divergence between price and stochastic oscillator. I look for high volume appearing on key areas on chart. See the second image for daily.
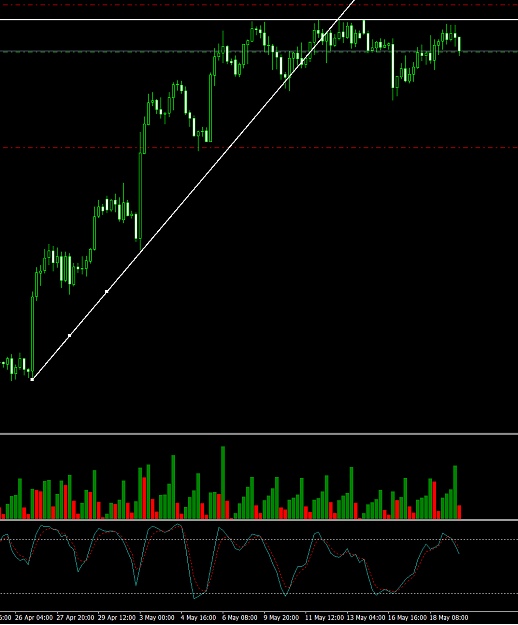
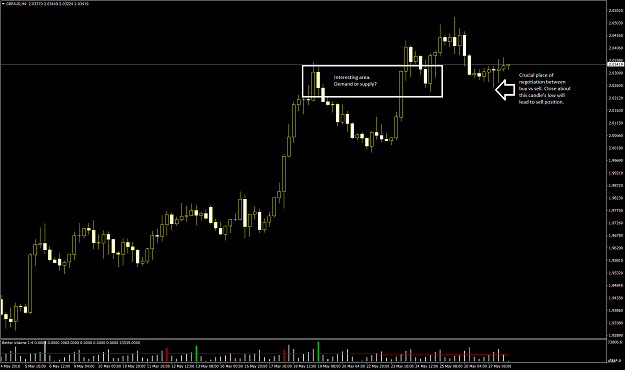
STEP 3: If I am not travelling and working from home, I will zoom further into the 4 hour charts and enter on break of previous H4 support. Most of the time (like 90 percent of the time), I will enter when I notice weakness appear on the daily time frames.
Money Management: I will risk 2-5 % per trade. I like to scale into trades I am really sure about. So I will have up to three trades to build up a position, each trade being a third of my normal size. For risk management, place the stops above or below recent swing on the daily time frame. Since I am a medium to longer time frame trader, my stops tend to be atleast 100 pips but can be as much as three times ATR on daily time frame. So, GBP AUD trade, my initial s/l was 260 pips.