Hello fellow factory members -
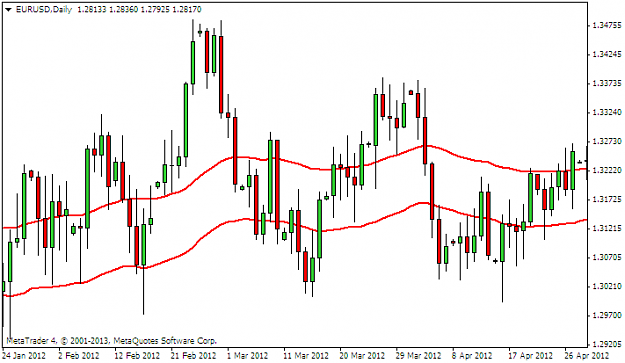
This thread will follow a method of identifying entry points on the daily charts in order to capture medium-term trends. It is based on price breakouts of the daily range within the 55 EMA High and the 55 EMA Low, as price tends to range when crossing these levels on the daily chart (or sometimes range very briefly and 'neatly', usually indicating a strong continuation).
Indicators:
For the initial alert:
55 EMA (daily, high)
55 EMA (daily, low)
For determining exits and stops:
14-day Average Direction Index (ADX)
14-day Average True Range (ATR)
For re-entering trending markets:
10-day EMA
For determining stops: fib levels, round numbers, the average daily range - stop loss should be moved into profit (if applicable) once a day only, ideally as soon as the last daily candle is printed.
This strategy is applicable to any cross, and is to an extent based on the idea that hedge funds and currency managers work on this time scale. (50 to 60 days is also arguably a significant market cycle.) These are very basic and popular ways of looking at the market, and so it is my intention to follow this strategy closely, making live trades and keeping specific data around the behaviour of the market between the 55 daily moving averages, and basically honing in on any aspect of the strategy I - or you - can think of, without changing any of the basic indicators.
Very simply, the entry signal is a daily close outside the 55 EMA high/low channel, in the direction of the breakout. There is nothing wrong with taking some time after this event to assess your entry point closely and using your own discretion, as long as it is within the next trading day.
This is my one and only daily-chart/trend trading strategy at the moment and I'm hoping to build up lots of data I can share.
A word of warning: This is a trend-trading strategy and as such, it is probable to experience sizable draw-downs. It is important to calculate your stop-loss ahead of time (that is, in fact, integral to the strategy), and to calculate your lot-sizing based on the distance between the stop order and the entry point. The total possible loss on any one trade should absolutely not be more than 1% of your account; I myself am targeting 0.5%. The idea, like any trading strategy, it cut your losses short and let the winners ride - it's just that this is on a larger scale. You should ordinarily be prepared to set a stop loss not less than the Average Daily Range, i.e. the ATR(14) on the daily chart.
When price hits the daily 55 EMA, it can sometimes range for five or six days - this in not a strategy for the impatient. Rather, it's important to monitor these signals across as many markets as possible, and to follow closely those markets which show potential.
In the two current charts below: the first is an example of a perfect winning trade on the NZDJPY. The second chart shows the EURAUD currently ranging between the two EMA's. The descent back to the range has been sharper than usual, but a daily close below the 55D-EMA would still be a signal to look for a sell.