Welcome! In this thread you will find regular market updates, trades and useful indicators to aid you in your trading.
VSA
Useful videos:
So what is VSA (Volume spread analysis) all about?
Volume Spread Analysis is a proven methodology of analyzing financial markets. First developed by Richard D. Wyckoff, one of the most successful Wall Street traders of all time, in the 1900s, and perfected by Tom Williams, during the time he was a syndicate trader for 15 years based in London in the 1960s-1970s. Other very successful Wall Street traders like William O'Neill use it as well. It's based on supply and demand, which governs any market, and not anything else: no technical indicators, no price patterns, just pure price and volume action.
Any business where there is money to be made there are professionals: Art has professional traders, poker has professional players, betting has professional betters, and likewise financial markets have professional traders. Being successful in the markets is all about following the footsteps of the 'sharks' of this game: market operators, pit traders, market-makers, syndicate traders and top professional traders. The purpose of VSA is to show you what the professionals are doing by analyzing the price movements and volumes, and profit with that knowledge!
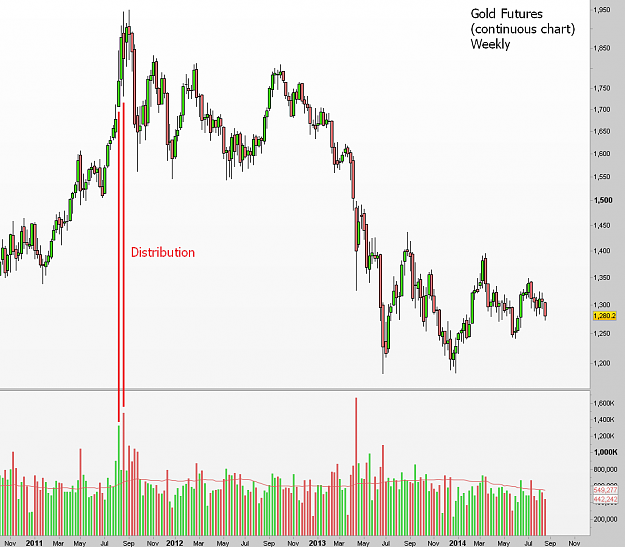
Let's see some examples: in the gold top in September/2011, there was major supply - the strong holders (professionals) dumped their gold futures stock on the weak holders (the public), and it is visible by high volume and sluggish price increase, typical of a distribution.
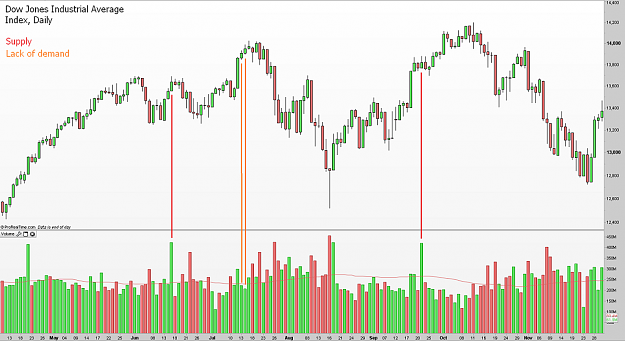
In the 2008 top of the American stock market, there was also distribution and lack of demand at higher prices right before the bear market started.
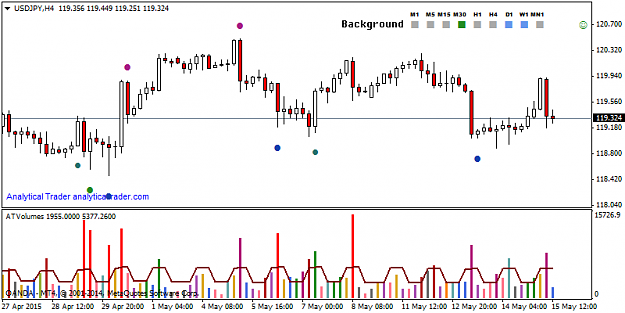
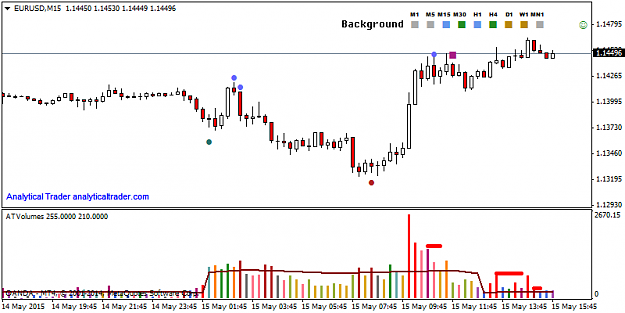
The principle applies to any market in any timeframe, and you see the same exact setups. In forex, you can use tick volumes, since it also measures equally well the market activity.
Indicator features
Contacts
Feel free to contact us with any question or problem:
Contacts
Trade Blog
Blog
Free Indicators:
AT - Supports & Resistances (automatic S&R drawing)
AT - Dynamic Trend (low lagging and smooth state-of-the-art MA)
AT - Pivots (Daily, weekly and monthly pivots with corresponding supports/resistances)
AT - Spreads (shows pair's spread, along with relative weight to the avg. movement)
AT - News (shows news events in the chart, featuring alerts)
Useful resources
'Master the Markets', by Tom Williams - THE VSA book
'Method of Tape Reading', by Richard D. Wyckoff
'Trades About to Happen', by David Weis
VSA
Useful videos:
Inserted Video
Inserted Video
So what is VSA (Volume spread analysis) all about?
Volume Spread Analysis is a proven methodology of analyzing financial markets. First developed by Richard D. Wyckoff, one of the most successful Wall Street traders of all time, in the 1900s, and perfected by Tom Williams, during the time he was a syndicate trader for 15 years based in London in the 1960s-1970s. Other very successful Wall Street traders like William O'Neill use it as well. It's based on supply and demand, which governs any market, and not anything else: no technical indicators, no price patterns, just pure price and volume action.
Any business where there is money to be made there are professionals: Art has professional traders, poker has professional players, betting has professional betters, and likewise financial markets have professional traders. Being successful in the markets is all about following the footsteps of the 'sharks' of this game: market operators, pit traders, market-makers, syndicate traders and top professional traders. The purpose of VSA is to show you what the professionals are doing by analyzing the price movements and volumes, and profit with that knowledge!
Let's see some examples: in the gold top in September/2011, there was major supply - the strong holders (professionals) dumped their gold futures stock on the weak holders (the public), and it is visible by high volume and sluggish price increase, typical of a distribution.
In the 2008 top of the American stock market, there was also distribution and lack of demand at higher prices right before the bear market started.
The principle applies to any market in any timeframe, and you see the same exact setups. In forex, you can use tick volumes, since it also measures equally well the market activity.
Indicator features
- Fully automatic and complete VSA analysis
- Accurate bar-by-bar analysis, in multiple timeframes
- Background scanner
- Applicable to any market in any timeframe
- Very simple to use
- Metatrader alerts, email and push notifications
- Strictly non-repainting indicator
Indicator features in detail
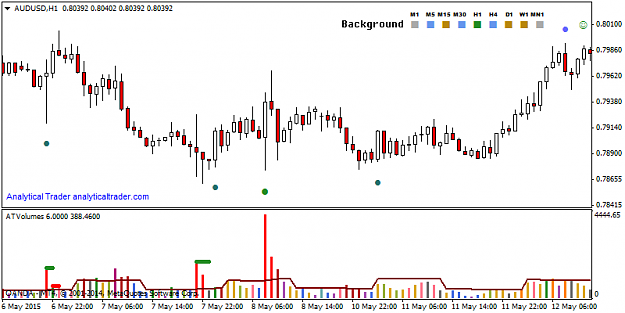
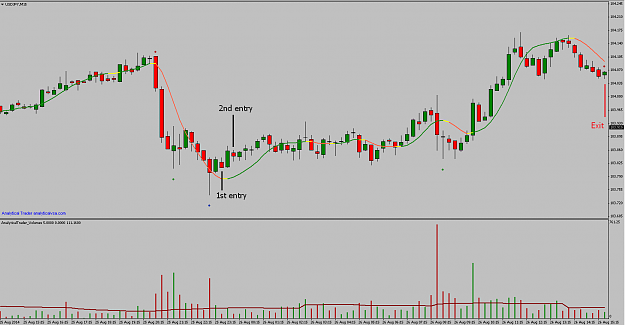
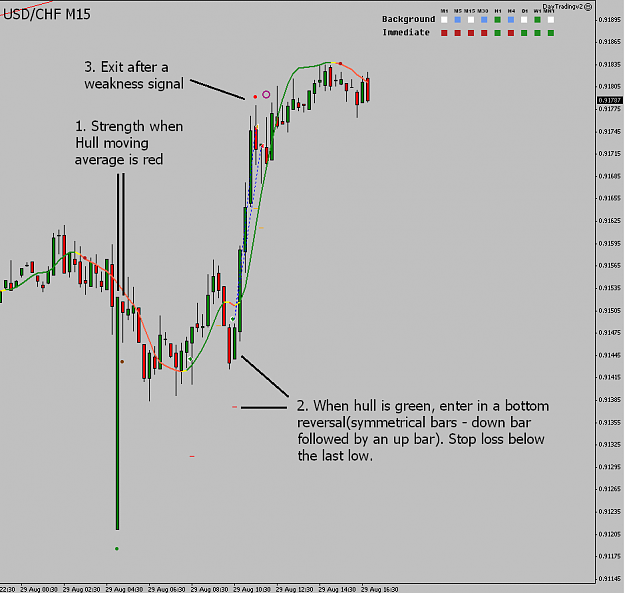
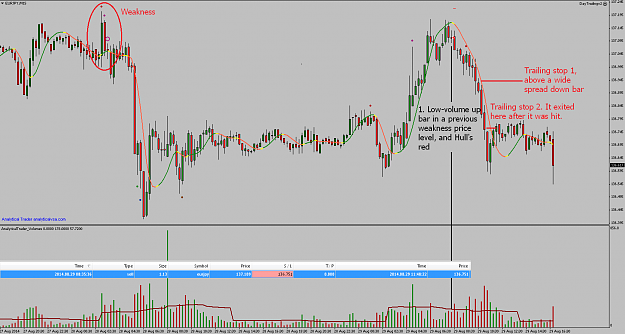
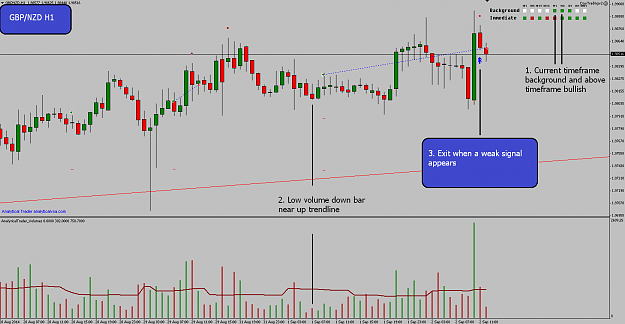
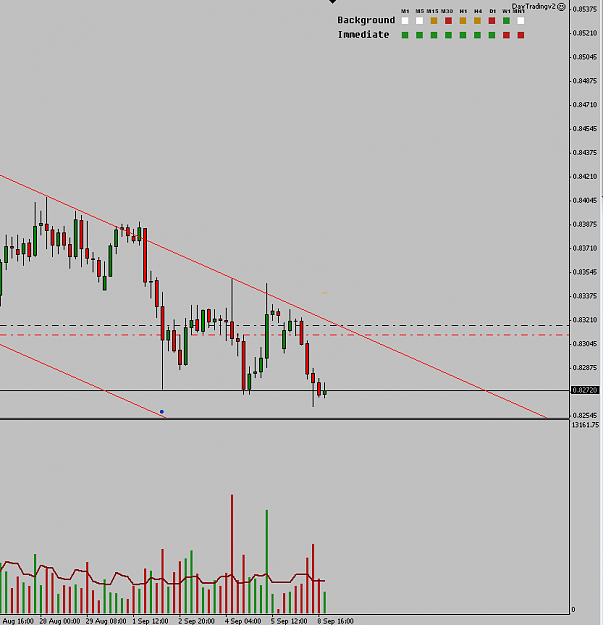
- Every supply, demand, or lack of supply/demand bar is marked with a specific color. Analytical Trader automatically scans the current timeframe and the two timeframes above the current one for these signals, and marks everything it finds in the current chart, so you get a multi-timeframe analysis in just one chart.
These will point out market reversals with an accuracy rate of 75-80%. - The background analyzes the trend and VSA signals, and tells you the consensus of opinion of institutional traders and professionals. This basically will tell you in which side of the market should you be: you never want to trade against the smart money! The background will also tell you the weight you should give to the demand or supply signals the market is generating.
FAQ
- Is VSA suitable for traders who haven't even heard of Volume Spread Analysis (VSA)?
Of course! The indicator marks all the important bars, computes the background automatically, so you don't have to worry about how it's done. - How can Analytical Trader help VSA traders?
It accerelates VSA learning: if there is a VSA bar, this indicador will draw it. By marking every important bar, and telling you how the background is like, is almost like having a teacher at your side teaching you on what you should look for. You can also compare your own analysis to Analytical Trader analysis. - What makes Analytical Trader different from other VSA products?
The VSA indicators we tried, clearly weren't verified by a VSA trader nor were they programmed with the minimum care. They draw almost every bar as supply or demand, which is inconsistent with VSA, and getting mixed signals consistently doesn't help trading no matter how you look at it. There are also those repainting types, who conveniently erase or draw bars when the action already developed: good for product marketing, useless for trading. In contrast, Analytical Trader is non-repainting, marks the important bars, which happen to predict a lot of tops and bottoms in the market, and provides you with an accurate background analysis as an experienced VSA trader would do. - Does it work with tick volumes?
Yes, tick volume works the same way as real volume as VSA is concerned, as it measures the activity in the market. Plus it's highly correlated with real volumes in futures, as brokers gather volume data from many other brokers.
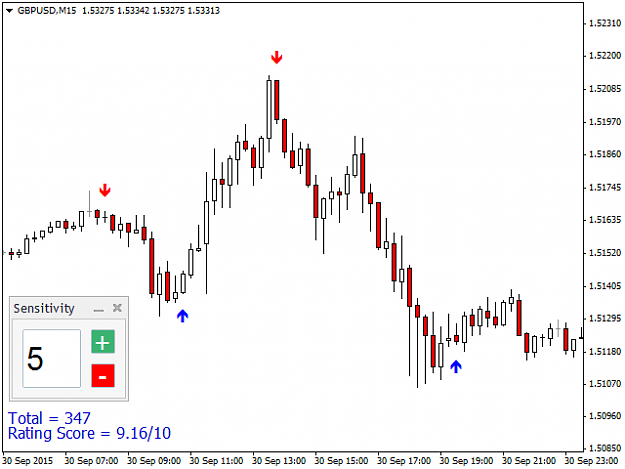
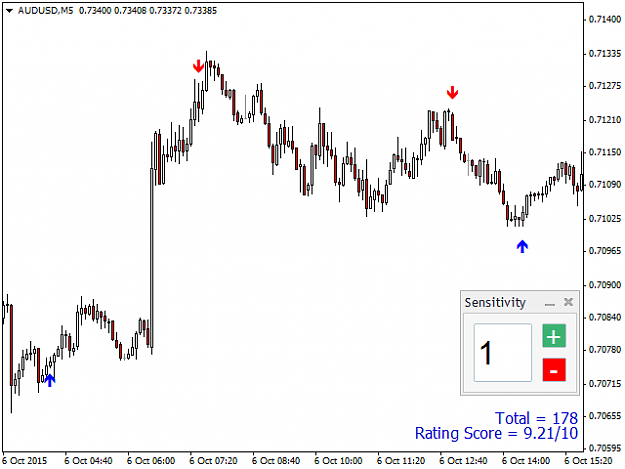
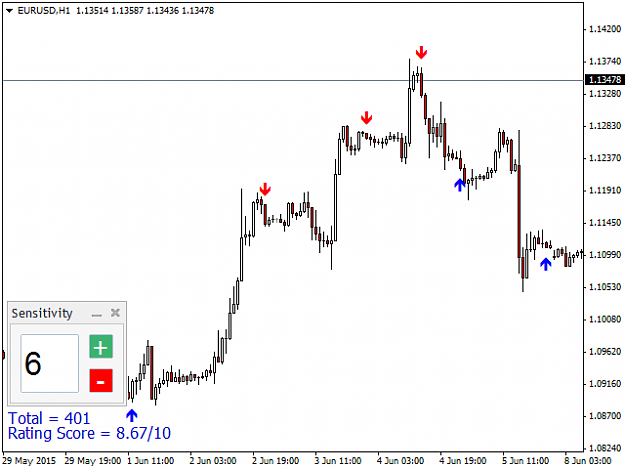
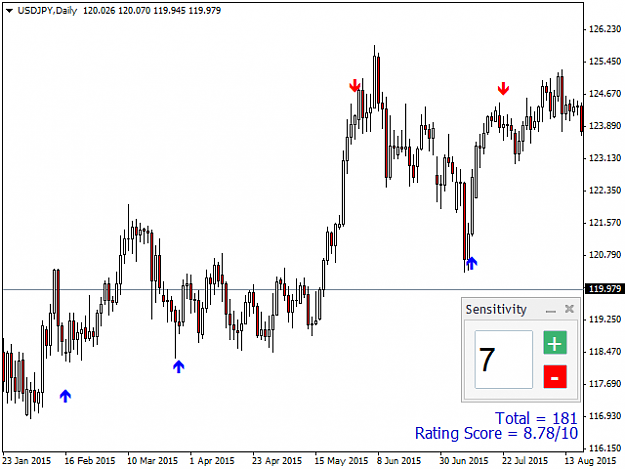
Reversals
Reversals is a Metatrader 4 indicator that recognizes patterns in price and volume action to determine price reversals accurately. These should be used within a trading system, either as entry or exit points, or as a confirmation of a trend reversal. It looks for different patterns than VSA does, so both can be complemented. The indicator also brings an adjustable sensitivity, changed directly in the chart, which allows to very easily adjust the indicator to the market and to your own trading method.
Inserted Video
Contacts
Feel free to contact us with any question or problem:
Contacts
Trade Blog
Blog
Free Indicators:
AT - Supports & Resistances (automatic S&R drawing)
AT - Dynamic Trend (low lagging and smooth state-of-the-art MA)
AT - Pivots (Daily, weekly and monthly pivots with corresponding supports/resistances)
AT - Spreads (shows pair's spread, along with relative weight to the avg. movement)
AT - News (shows news events in the chart, featuring alerts)
Useful resources
'Master the Markets', by Tom Williams - THE VSA book
'Method of Tape Reading', by Richard D. Wyckoff
'Trades About to Happen', by David Weis
Attached Image(s) (click to enlarge)