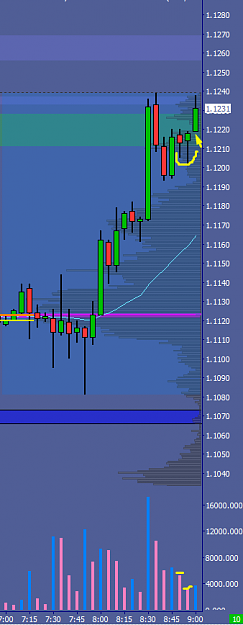
{quote} Hi Hiero, I think this is a successful test. rite? Thanks, LO-Trader
Ignored
The volume wasnt right for it to be an actual test. If that inverted hammer type candle was on volume less than the previous two, it would be a test for demand (in my world, its not a real thing to some) and then the next candle would actually fail the test, so it would have been a failed test, here a sign of strength. That's still basically what happened. London was on a mission up and the candle before IH was no supply also. Resistance became support with IH and that IH was a London candle, the next candle was up and a New York candle. It was also just in the moment intuition and also my TPO charts. I suppose I can't really articulate all the reasons why very well, thats why I didn't write anything : )
{quote} The volume wasnt right for it to be an actual test. If that inverted hammer type candle was on volume less than the previous two, it would be a test for demand (in my world, its not a real thing to some) and then the next candle would actually fail the test, so it would have been a failed test, here a sign of strength. That's still basically what happened. London was on a mission up and the candle before IH was no supply also. Resistance became support with IH and that IH was a London candle, the next candle was up and a New York candle....
Ignored
Cool. Understood.
Why do I keep forgetting about the test(volume should be less than previous two candles)? Impose it man. They are the basics.
|
Joined Nov 2012
|
Status: Practitioner of Uncertainty
|213 Posts
Hi Hiero,
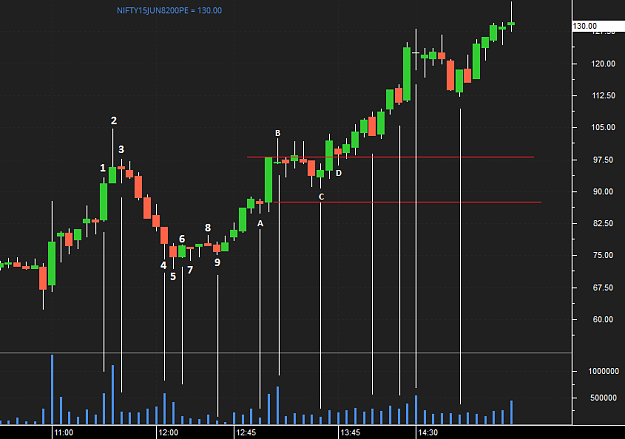
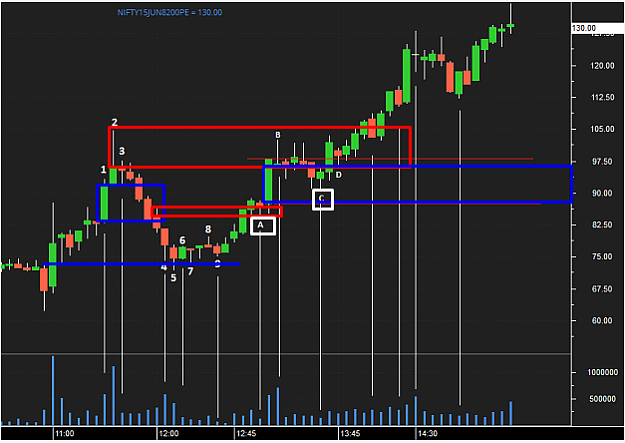
Volume looks to be much better today on NIFTY option. Below chart is on M5 time frame. When I look back now I feel like it is following VSA principles.
2: volume was too high and bar closed below 30% of the range. Lot of selling.
4 & 5: looks like stopping volume
6: less volume on a upbar. ND. no sign of going up. But SOS.
7: was a successful test.
8: supply coming back to market.
9: was a successful test as the next bar was up.
A: was a successful test as the next bar was up.
B: supply swamping demand. SOW. But next bar was a successful test.
C: successful test.
{quote} Cool. Understood. Why do I keep forgetting about the test(volume should be less than previous two candles)? Impose it man. They are the basics. Thanks, LO-Trader
Ignored
No problem. It's all good, once you get really good and have spent many many hours reading charts, you no longer need rules or guidelines. I have days such as that but not often enough yet. There is such a thing as a high volume test as well and tests on candles with volume less than only one candle before, a whole world of stuff actually, that you will find for yourself and can't really teach. The rules for a system such as VSA or any method, are just there to help, until you can go beyond them and make your own discoveries. I rarely write even half of what I see on a chart when I post it, just the basic things.
{quote} No problem. It's all good, once you get really good and have spent many many hours reading charts, you no longer need rules or guidelines. I have days such as that but not often enough yet. There is such a thing as a high volume test as well and tests on candles with volume less than only one candle before, a whole world of stuff actually, that you will find for yourself and can't really teach. The rules for a system such as VSA or any method, are just there to help, until you can go beyond them and make your own discoveries. I rarely write...
Hi Hiero, Volume looks to be much better today on NIFTY option. Below chart is on M5 time frame. When I look back now I feel like it is following VSA principles. 2: volume was too high and bar closed below 30% of the range. Lot of selling. 4 & 5: looks like stopping volume 6: less volume on a upbar. ND. no sign of going up. But SOS. 7: was a successful test. 8: supply coming back to market. 9: was a successful test as the next bar was up. A: was a successful test as the next bar was up. B: supply swamping demand. SOW. But next bar was a successful...
Ignored
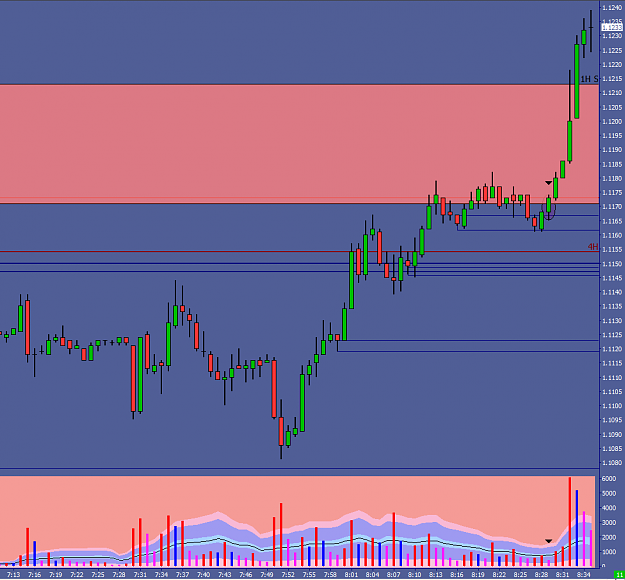
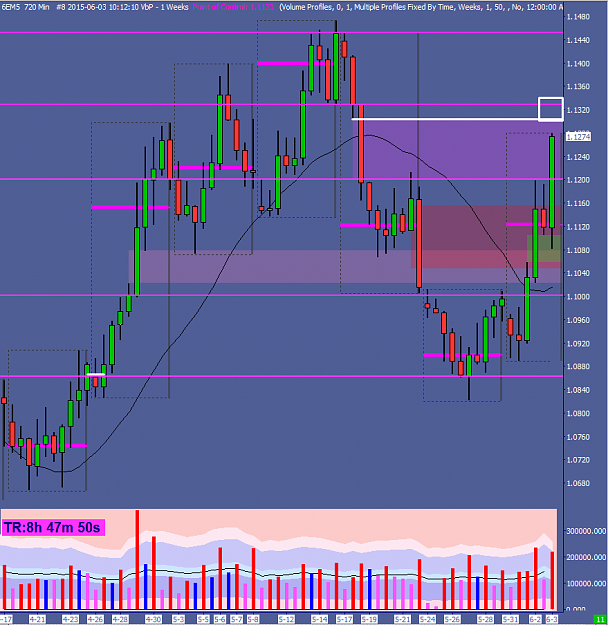
Am just on my phone about to sleep so can't really comment on that chart well. The close of the candle after #3, failed #3 test for supply, a good SoW. I like these trades because I use a pretty tight stop, good R:R. See that candle towards the left that has the highest volume and closes close to 50%? I usually draw a line where the wicks of the candle before and after it would touch when there is no hidden gap, i just call it a 0 tick HG. See it acting as support for your 4,5,6,7,8,9 candles? Candle "A" is the only long I would have considered, a good test candle.
One other thing, this (everything I've been talking about) is the easy part of trading. The hard part is growing a pair and sticking in a trade that you must stay in and managing it well. This is my biggest problem. Leaving a trade once it goes against your predefined risk is easy, that's what a stop loss is for. I find almost every day, without fail, if I would have just kept my trade going, I'd be up much more than usual. The psychology of greed and fear is a bitch to overcome.
{quote} Am just on my phone about to sleep so can't really comment on that chart well. The close of the candle after #3, failed #3 test for supply, a good SoW. I like these trades because I use a pretty tight stop, good R:R. See that candle towards the left that has the highest volume and closes close to 50%? I usually draw a line where the wicks of the candle before and after it would touch when there is no hidden gap, i just call it a 0 tick HG. See it acting as support for your 4,5,6,7,8,9 candles? Candle "A" is the only long I would have considered,...
Ignored
Okey. Let me try to do the drawing myself and will post the chart.
One other thing, this (everything I've been talking about) is the easy part of trading. The hard part is growing a pair and sticking in a trade that you must stay in and managing it well. This is my biggest problem. Leaving a trade once it goes against your predefined risk is easy, that's what a stop loss is for. I find almost every day, without fail, if I would have just kept my trade going, I'd be up much more than usual. The psychology of greed and fear is a bitch to overcome.
Ignored
What easy for you is still not easy for me .
I realize from what you said, letting your profits run is tough to do than cutting your losses. Greed and fear, the animal part of humans. They were so important and is part of our genes for so long, they protect us. I know even if I have a solid system, without conquering(or better confronting) them, I will not succeed. Don't know how long it gonna take. But I m not in a hurry. Let us enjoy the journey of transition.
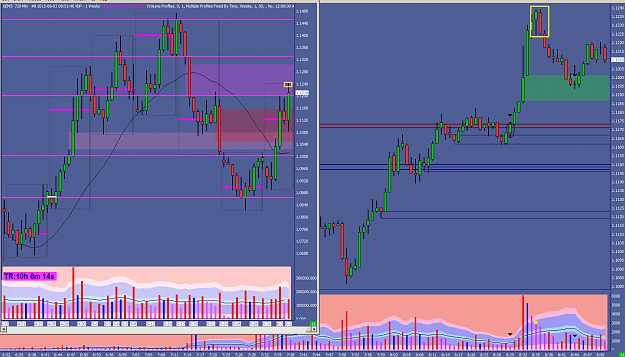
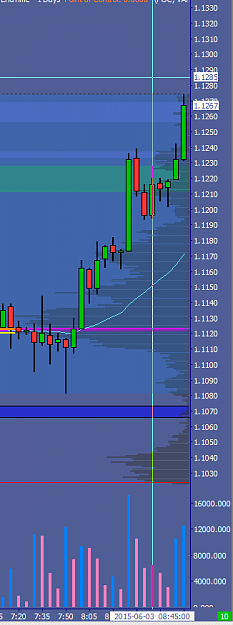
This is a nice hangman here. It's a failed test as well but when it's in the right spot, it's also a real hangman. The 12h chart on left shows a lot. Each candle is Asia/London or N.Y. no weekend data.
12h,1m
{quote} Am just on my phone about to sleep so can't really comment on that chart well. The close of the candle after #3, failed #3 test for supply, a good SoW. I like these trades because I use a pretty tight stop, good R:R. See that candle towards the left that has the highest volume and closes close to 50%? I usually draw a line where the wicks of the candle before and after it would touch when there is no hidden gap, i just call it a 0 tick HG. See it acting as support for your 4,5,6,7,8,9 candles? Candle "A" is the only long I would have considered,...
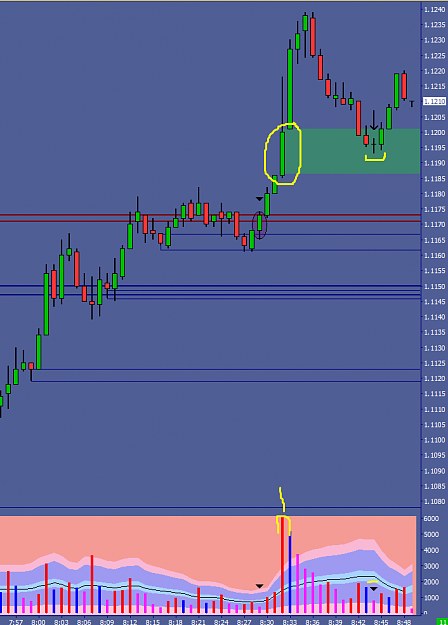
{quote} 0 tick HG line looks good. {image} Thanks, LO-Trader
Ignored
Something like what I would have on chart. I'd never take a trade from analysis from only 1 timeframe though. A is testing where there used to be supply and C is testing in a HG.
{quote} Something like what I would have on chart. I'd never take a trade from analysis from only 1 timeframe though. A is testing where there used to be supply and C is testing in a HG. {image}
Ignored
Thanks Hiero. Will try to do myself before posting next time. Learning a lot from you.