Sorry, my english is not good, can be difficult to interpret.
I first want to thank Mr.Pip and his topic: Ratios & Harmonics: a Different Way to Trade
here its conflict of Mr.Pip advanced models and Scott Carney: trading volume one & two.
therefore discuss here only models ABCD and AB = CD pattern
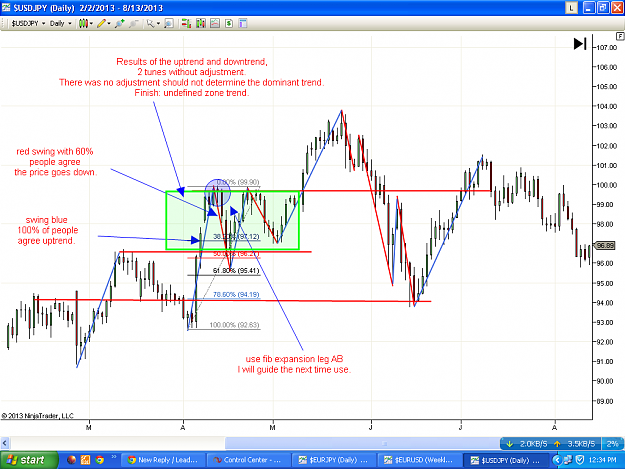
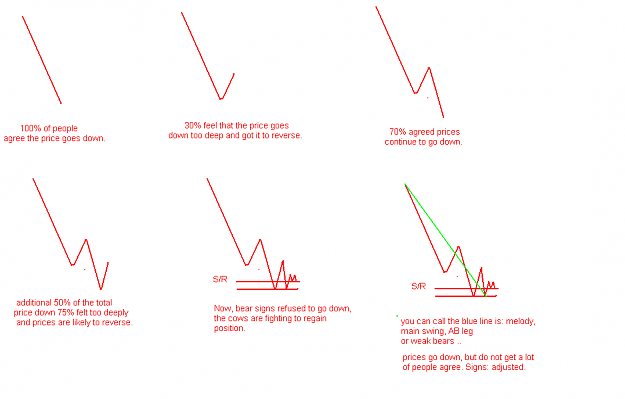
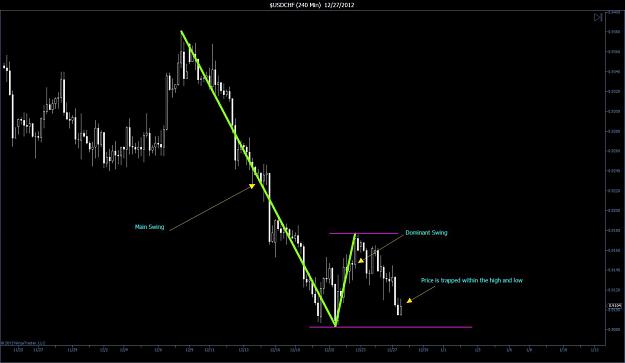
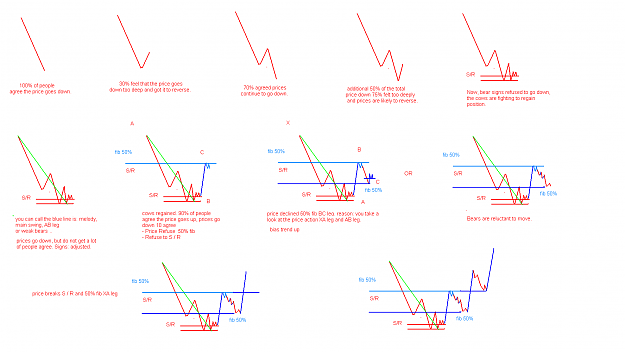
Here is the new. Analysis method essence of this method is: mass psychology and price action analysis. I call it: the dominant trend.
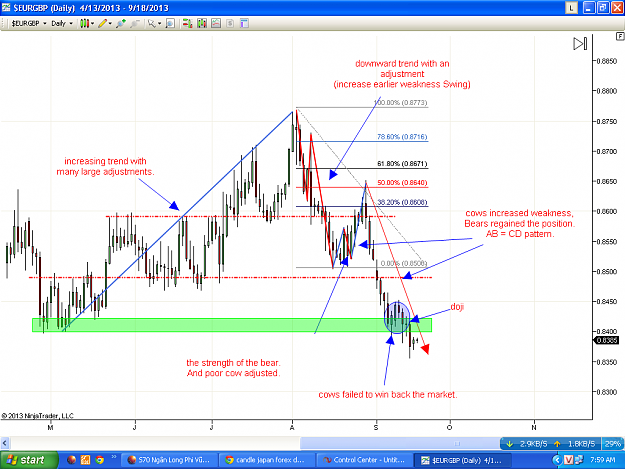
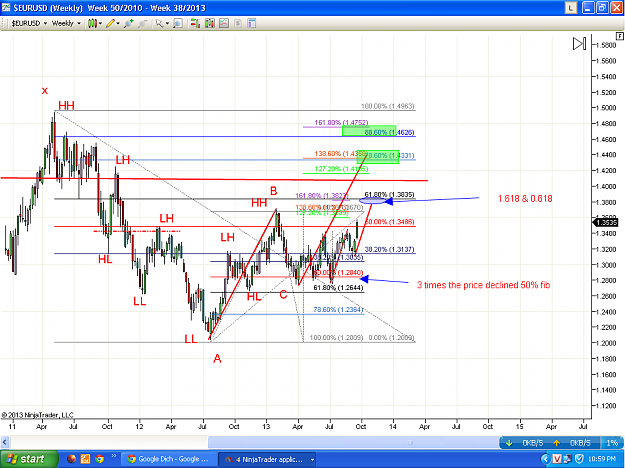
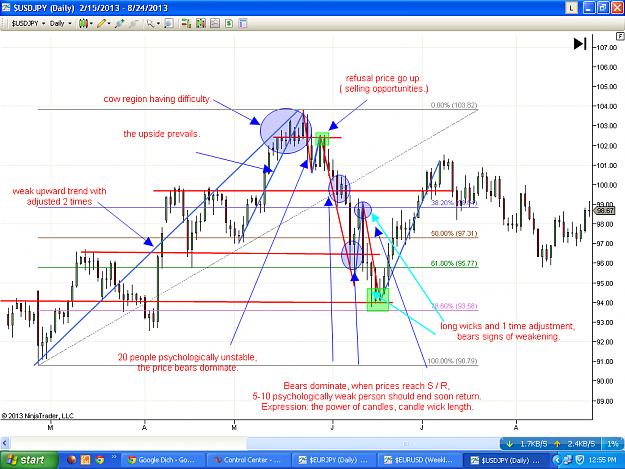
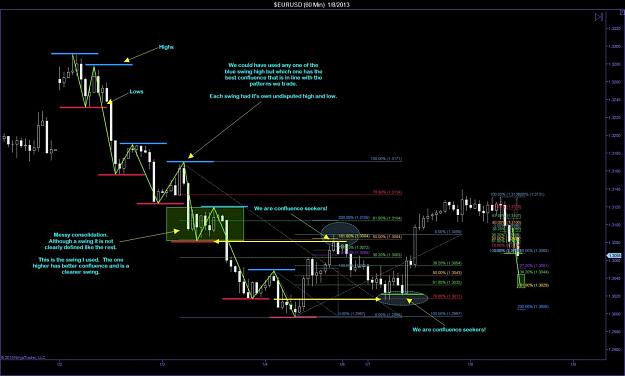
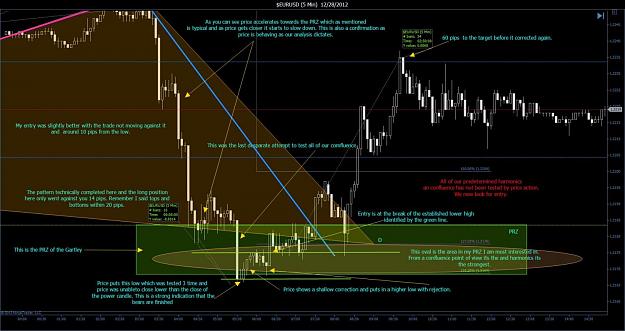
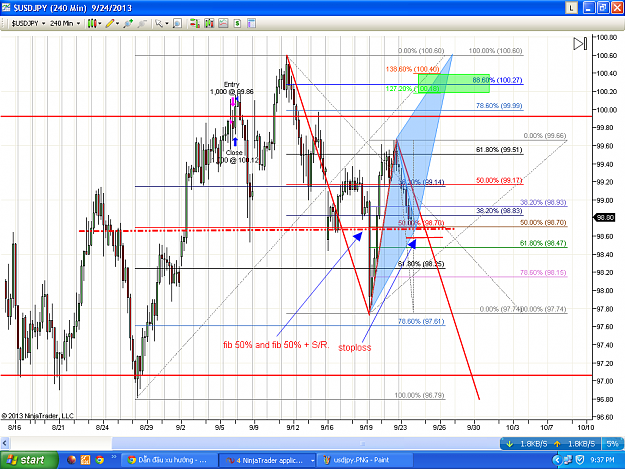
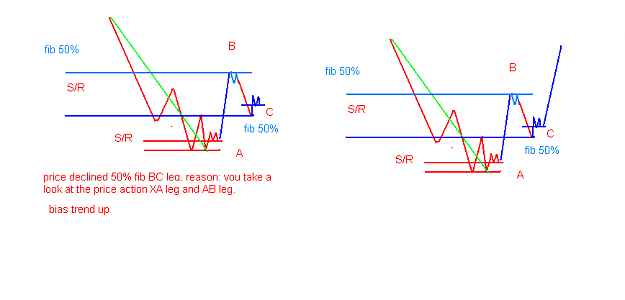
Application: measuring the strength of the current trend. recement use fib command to find opportunities and identify trend short-term and long-term. Price can break S / R or respected S/R,
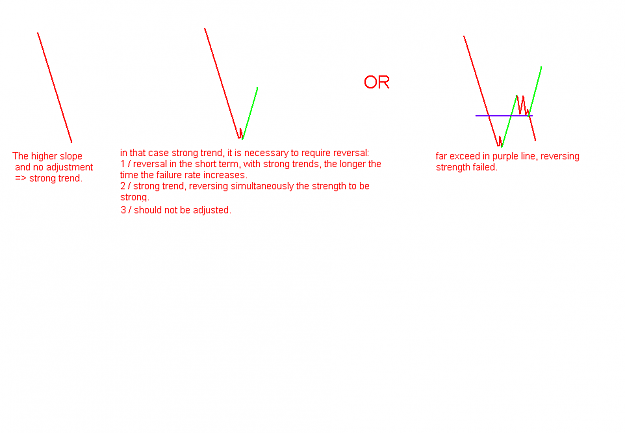
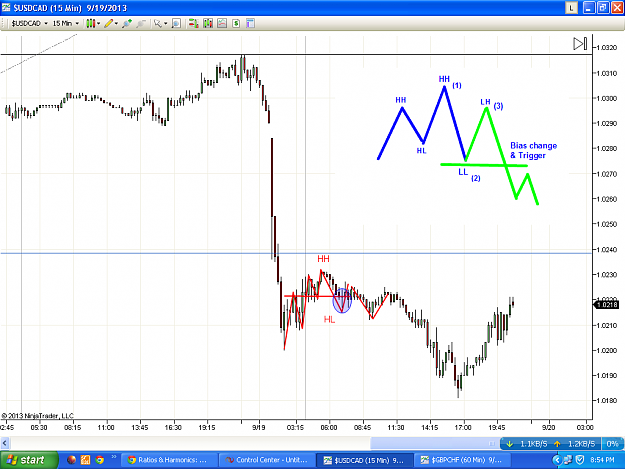
used psychological measure trend strength. First you need to determine AB leg. On your leg AB and determine level of structural adjustment HH / LL (structural HH / LL affect reversal region, it can support or canceled.) Legs AB has many adjustable or HH / LL => weakening trend. In contrast, AB pins adjusts weak or no adjustment. => Strong trend. it is very simple.
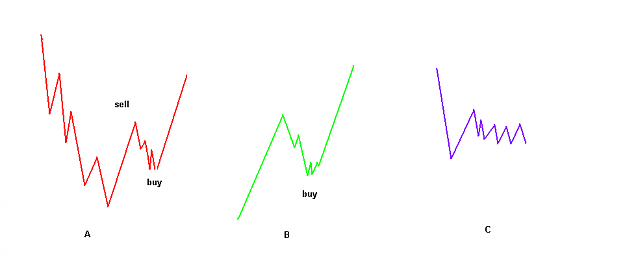
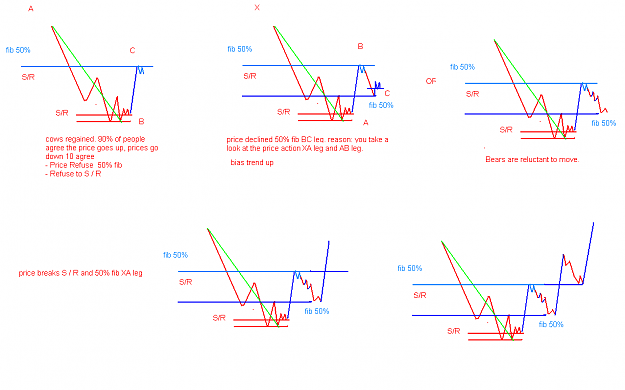
Why I choose the ABCD model, help me find ABCD pattern reversal region and it expresses prices rising or falling action in a simple way.
rules:
1/Do not send photos using indicator
2/ picture: price action.
okey, beginning: what you learn here:
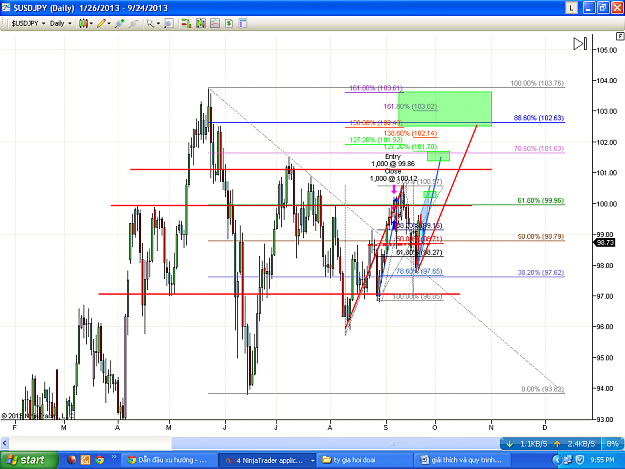
1 / trends identified short and long term.
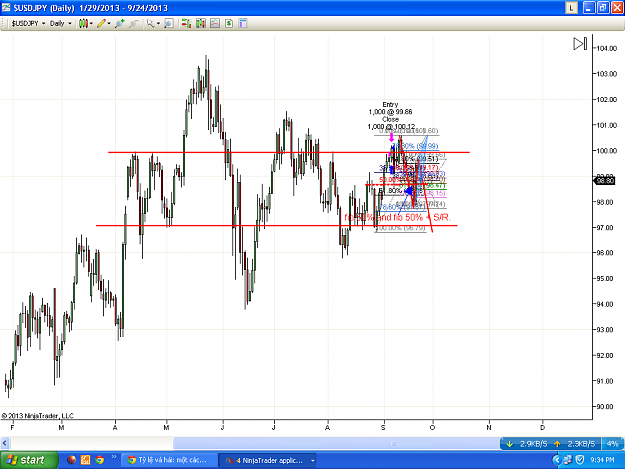
2 / when prices can break S / R.
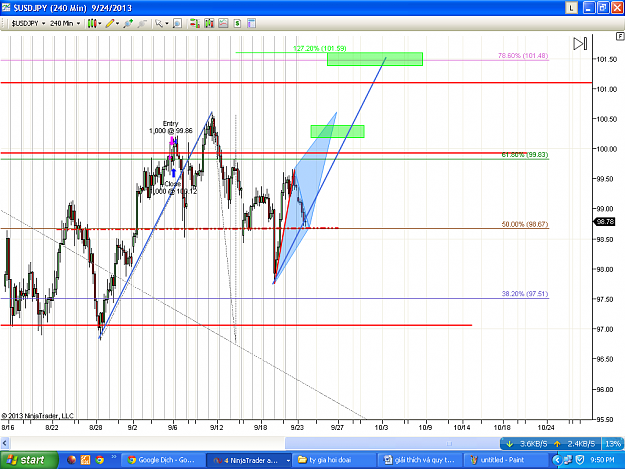
3 / predetermined neutral zone in the future.
4 / commercial CD leg.
use:
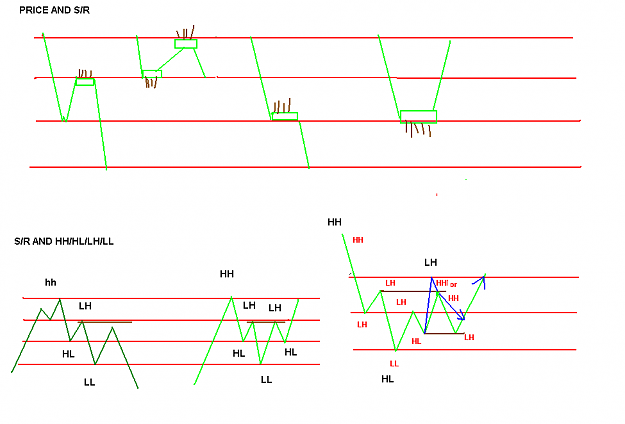
1 / S / R
2 / supply & demand (optional)
3 / HH / HL / LH / LL. & adjustment
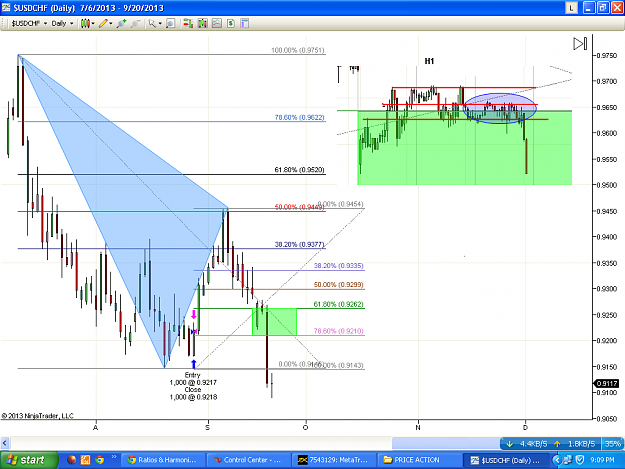
4 / using fibonacci
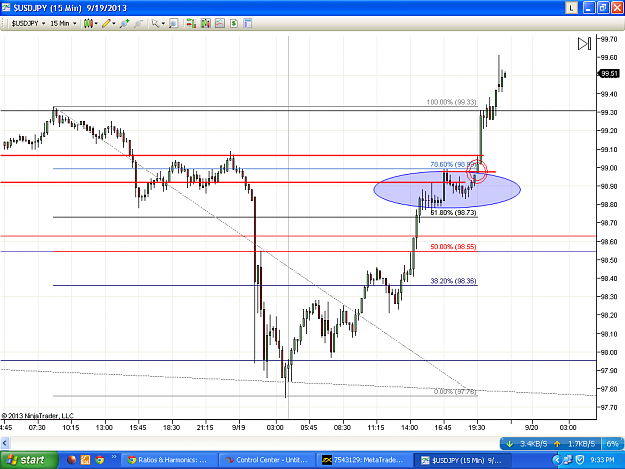
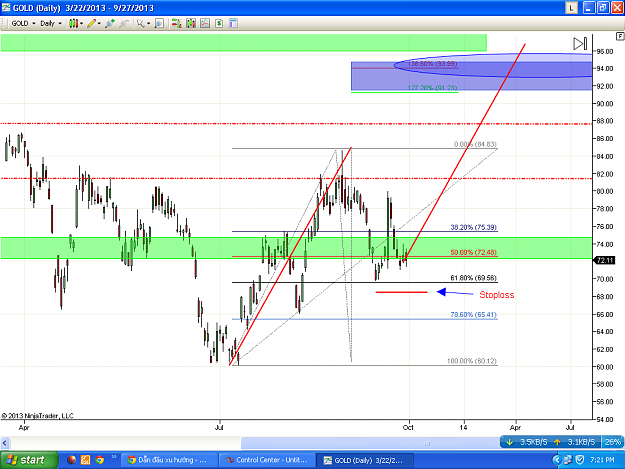
AB = CD pattern with the lowest regression = 38.6 and maximum = 78.6
ABCD model with the lowest level of 61.8 regressive and no wick candle near the 78.6
I first want to thank Mr.Pip and his topic: Ratios & Harmonics: a Different Way to Trade
here its conflict of Mr.Pip advanced models and Scott Carney: trading volume one & two.
therefore discuss here only models ABCD and AB = CD pattern
Here is the new. Analysis method essence of this method is: mass psychology and price action analysis. I call it: the dominant trend.
Application: measuring the strength of the current trend. recement use fib command to find opportunities and identify trend short-term and long-term. Price can break S / R or respected S/R,
used psychological measure trend strength. First you need to determine AB leg. On your leg AB and determine level of structural adjustment HH / LL (structural HH / LL affect reversal region, it can support or canceled.) Legs AB has many adjustable or HH / LL => weakening trend. In contrast, AB pins adjusts weak or no adjustment. => Strong trend. it is very simple.
Why I choose the ABCD model, help me find ABCD pattern reversal region and it expresses prices rising or falling action in a simple way.
rules:
1/Do not send photos using indicator
2/ picture: price action.
okey, beginning: what you learn here:
1 / trends identified short and long term.
2 / when prices can break S / R.
3 / predetermined neutral zone in the future.
4 / commercial CD leg.
use:
1 / S / R
2 / supply & demand (optional)
3 / HH / HL / LH / LL. & adjustment
4 / using fibonacci
AB = CD pattern with the lowest regression = 38.6 and maximum = 78.6
ABCD model with the lowest level of 61.8 regressive and no wick candle near the 78.6
Inserted Video
Attached Image(s) (click to enlarge)
Trading in the zone