Hi,
Here's a bit of background and info on the software:
I have a stock trading software called Visual Trader. Basically you can display measurements like Volatility, trend, RSI, CCI, and custom coded indicators in the form of cylinders. You can have 4 different measurements displayed at the same time. Cylinder height, width, body color and top color.
The advantage of it with stocks is you can watch a huge number of stocks in 3D in realtime and as either individual stock or sectors (because you can group them together) start to breakout you can see it in real-time and take action.
It can do lots of other stuff, like noon-time based charts, automatic patterns, tones of indicators & custom coding language, multi-timeframe, alters, full strategies with entries & exits, options, ect. But the main thing about it that I am most interested in is being able to see the entire market at once in 3D.
It got me thinking what if I could look at groups of currencies to watch when one currency in strengthening over another.
I was able to adapt this stock trading software to FX. I made "plates" for all the major currencies and the cylinders inside are the actual pairs.
Ex.
AUD plates consists of:
AUDCAD
AUDCHF
AUDEUR
AUDGBP
AUDJPY
AUDNZD
AUDUSD
Now you don't actually trade AUDEUR or AUDGBP, you trade the inverse. But we use these in the plate so we can see when AUD is strengthening against all other currencies.
Hopefully these pictures will explain it a bit better.
The charts are 60min HA charts.
We are just using the RSI(7) indicator as the cylinder height and color.
When it's above the 50 line the cylinder is above the plate. When below the 50 line it's below the plate.
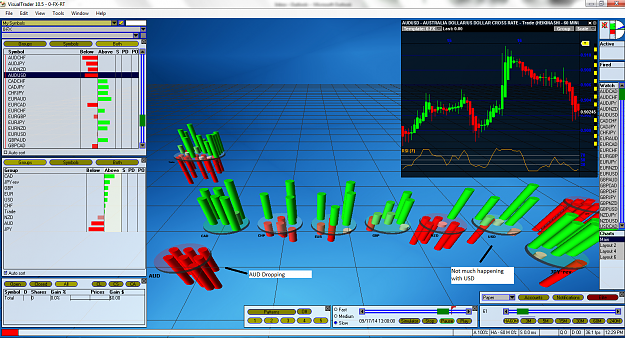
Picture 1:
From this you can quickly see that all the AUD pairs are weak which means their RSI(7) is well below the 50 line (they are very RED)
And USD is pretty mixed. 3 up, 1 down and 3 flat.
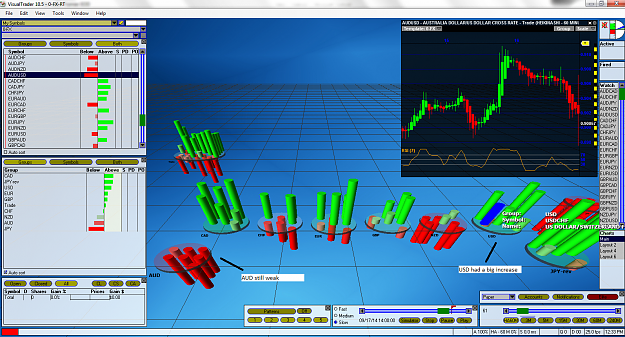
Picture 2:
USD spiked the next hour and almost all of them are well above their RSI 50 level
AUD still weak
So say we shorted AUDUSD, purely because USD is strong against all currencies and AUD is weak against all currencies.
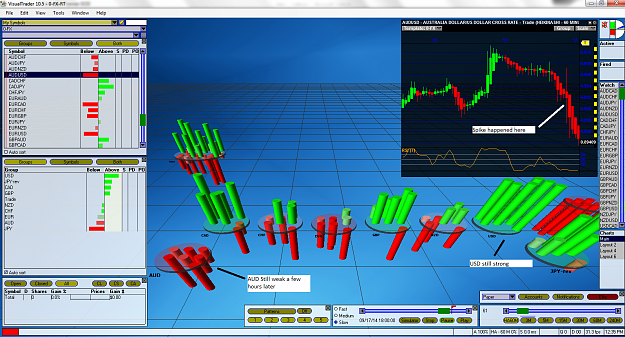
Picture 3:
Over the next 4 hours USD remained strong and AUD remained weak. You can see how the AUDUSD continued to drop.
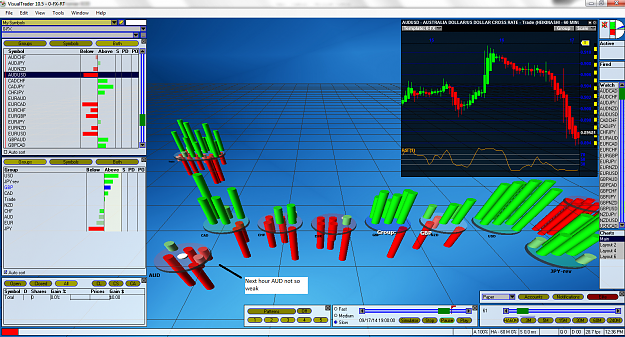
Picture 4:
USD is still nice and strong, but you can see that AUD is gaining strength against the other currencies.
So say we exit now.
Picture 5:
Over the next 4 hours AUD continued to gain strength and USD weakened again.
But we would have got out (pretty much at the bottom) before it started going up because even though USD remained strong in picture 4, AUD was showing overall it wasn't maintaining that weakness.
Obviously I picked this example out because it illustrated this comparing currencies pretty good.
I've even coded the complex common indicator in the software because it's doing a similar thing with comparing currencies. And using the complex common with the cylinders you can see how each pair is contributing to the "main" currencies strength and weakness.
Here's the complex common indicator for those that don't know about it (http://www.forexfactory.com/showthread.php?t=109599)
So my question to traders out there is:
Does anyone trade using measurements or levels ect. that you compare from one currency to another to decide which pair for that currency you are going to trade.
So say all your AUD currencies are showing a sell signal (maybe by a trendline break). Do you have some measurement to decide which pair to trade or which one is more likely to drop more and faster than then rest.
RSI is just one example. But you can code things like distance from a moving average. Or distance from the prior high. Or Stochastic levels.
Sorry for the long post. Thought it might just be interesting to some people as a "new" way to look at the FX market.
Here's a bit of background and info on the software:
I have a stock trading software called Visual Trader. Basically you can display measurements like Volatility, trend, RSI, CCI, and custom coded indicators in the form of cylinders. You can have 4 different measurements displayed at the same time. Cylinder height, width, body color and top color.
The advantage of it with stocks is you can watch a huge number of stocks in 3D in realtime and as either individual stock or sectors (because you can group them together) start to breakout you can see it in real-time and take action.
It can do lots of other stuff, like noon-time based charts, automatic patterns, tones of indicators & custom coding language, multi-timeframe, alters, full strategies with entries & exits, options, ect. But the main thing about it that I am most interested in is being able to see the entire market at once in 3D.
It got me thinking what if I could look at groups of currencies to watch when one currency in strengthening over another.
I was able to adapt this stock trading software to FX. I made "plates" for all the major currencies and the cylinders inside are the actual pairs.
Ex.
AUD plates consists of:
AUDCAD
AUDCHF
AUDEUR
AUDGBP
AUDJPY
AUDNZD
AUDUSD
Now you don't actually trade AUDEUR or AUDGBP, you trade the inverse. But we use these in the plate so we can see when AUD is strengthening against all other currencies.
Hopefully these pictures will explain it a bit better.
The charts are 60min HA charts.
We are just using the RSI(7) indicator as the cylinder height and color.
When it's above the 50 line the cylinder is above the plate. When below the 50 line it's below the plate.
Picture 1:
From this you can quickly see that all the AUD pairs are weak which means their RSI(7) is well below the 50 line (they are very RED)
And USD is pretty mixed. 3 up, 1 down and 3 flat.
Attached Image (click to enlarge)
Picture 2:
USD spiked the next hour and almost all of them are well above their RSI 50 level
AUD still weak
So say we shorted AUDUSD, purely because USD is strong against all currencies and AUD is weak against all currencies.
Attached Image (click to enlarge)
Picture 3:
Over the next 4 hours USD remained strong and AUD remained weak. You can see how the AUDUSD continued to drop.
Attached Image (click to enlarge)
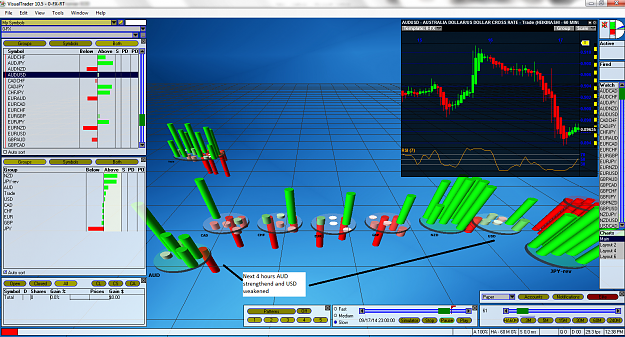
Picture 4:
USD is still nice and strong, but you can see that AUD is gaining strength against the other currencies.
So say we exit now.
Attached Image (click to enlarge)
Picture 5:
Over the next 4 hours AUD continued to gain strength and USD weakened again.
But we would have got out (pretty much at the bottom) before it started going up because even though USD remained strong in picture 4, AUD was showing overall it wasn't maintaining that weakness.
Attached Image (click to enlarge)
Obviously I picked this example out because it illustrated this comparing currencies pretty good.
I've even coded the complex common indicator in the software because it's doing a similar thing with comparing currencies. And using the complex common with the cylinders you can see how each pair is contributing to the "main" currencies strength and weakness.
Here's the complex common indicator for those that don't know about it (http://www.forexfactory.com/showthread.php?t=109599)
So my question to traders out there is:
Does anyone trade using measurements or levels ect. that you compare from one currency to another to decide which pair for that currency you are going to trade.
So say all your AUD currencies are showing a sell signal (maybe by a trendline break). Do you have some measurement to decide which pair to trade or which one is more likely to drop more and faster than then rest.
RSI is just one example. But you can code things like distance from a moving average. Or distance from the prior high. Or Stochastic levels.
Sorry for the long post. Thought it might just be interesting to some people as a "new" way to look at the FX market.