I have been using pivot points with good success from some time. The reason they work is because so many people look at them to determine intra-day support and resistance- so it becomes a self fulfilling prophecy.
Here are the "rules" of my "method":
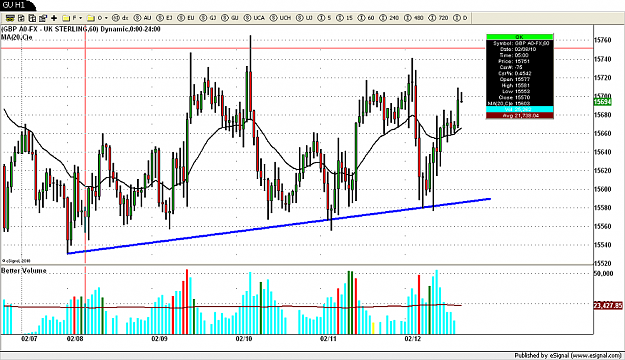
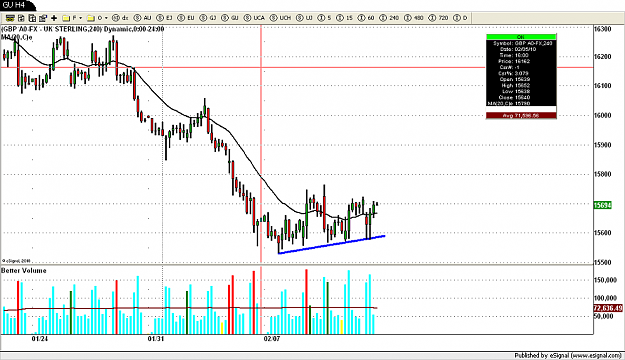
Time Frames: I use H1 and H4 time frames. H1 time frame is used to see where the price is in relation to the pivots. H4 time frame is used to gauge the "background" mood in terms of Volume-spread analysis. I am still learning VSA and there are areas that I need to improve upon to be able to say anything with certitude on that matter.
Indicators: I use 3 "indicators"- Any pivot point indicator, 20 EMA, and Volume indicator. I already explained the rationale behind using Pivot points. I use the 20 EMA as a gauge of the momentum in favor of the direction- I believe once price is pushed above or below the 20 EMA that is a sign of confidence in that direction.
Pairs: No hard and fast rule here; but it is helpful if the pair is liquid for example EUR/USD, GBP/USD, AUD/USD, and USD/JPY
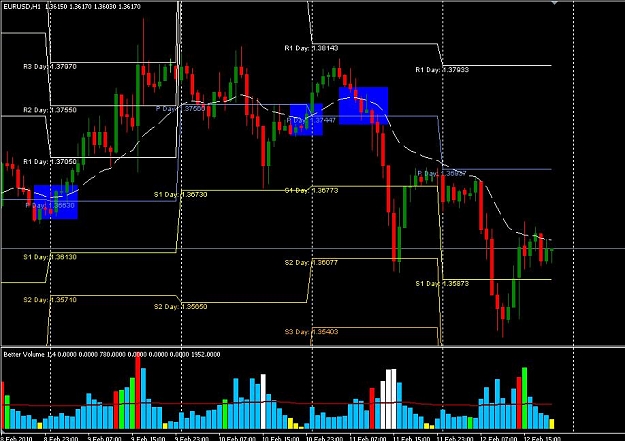
The "Method": main factor behind pulling the trigger is my analysis on the H4 time frame. Then I zoom down and pull the trigger based on the price crossing 20 EMA line (H1 Time frame). See attached image. I go long if there is a bullish cross-over of price over 20 EMA and price is either above the daily pivot or crosses it from below. I short the pair if there is a bearish cross-over of 20 EMA and the price closes below the pivot point.
Stop-Loss: I put stop 10 pips below the low of the candle that crosses over 20 EMA.
Take-Profit: There is no fixed target. I take profit if I don't like the PA. I set the initial T/P atleast 1 times or maximum 2 times of my S/L point. Move the stop to B/E once you are in 30 pip profit.
MM: I only take those trades that satisfy my 1% rule. That is, I do not risk more than 1% of my money on any one trade.
-5ABI
Here are the "rules" of my "method":
Time Frames: I use H1 and H4 time frames. H1 time frame is used to see where the price is in relation to the pivots. H4 time frame is used to gauge the "background" mood in terms of Volume-spread analysis. I am still learning VSA and there are areas that I need to improve upon to be able to say anything with certitude on that matter.
Indicators: I use 3 "indicators"- Any pivot point indicator, 20 EMA, and Volume indicator. I already explained the rationale behind using Pivot points. I use the 20 EMA as a gauge of the momentum in favor of the direction- I believe once price is pushed above or below the 20 EMA that is a sign of confidence in that direction.
Pairs: No hard and fast rule here; but it is helpful if the pair is liquid for example EUR/USD, GBP/USD, AUD/USD, and USD/JPY
The "Method": main factor behind pulling the trigger is my analysis on the H4 time frame. Then I zoom down and pull the trigger based on the price crossing 20 EMA line (H1 Time frame). See attached image. I go long if there is a bullish cross-over of price over 20 EMA and price is either above the daily pivot or crosses it from below. I short the pair if there is a bearish cross-over of 20 EMA and the price closes below the pivot point.
Stop-Loss: I put stop 10 pips below the low of the candle that crosses over 20 EMA.
Take-Profit: There is no fixed target. I take profit if I don't like the PA. I set the initial T/P atleast 1 times or maximum 2 times of my S/L point. Move the stop to B/E once you are in 30 pip profit.
MM: I only take those trades that satisfy my 1% rule. That is, I do not risk more than 1% of my money on any one trade.
-5ABI
Attached Image (click to enlarge)
Its all in the mind.