As a trader, you have probably heard the old saying that it is best to trade with the trend. The trend is your friend. This is certainly a valid advice as long as you know and can accept that the trend can end. And then you need to identify the new trend direction.
So the important question is, how can we determine the direction of the trend? I believe in the “keep it simple” rule. Here is a simple method of anticipating the direction of the trend, and a strategy to take advantage of the opportunities presented by the trend.
Before we get started, I want to mention the importance of time frames in determining the trend. Usually, when we are analysing long-term investments the long-term time frame dominates the shorter time frames. However, for intraday purposes, the shorter time frame could be of greater value. Trades can be divided into three classes of trading styles or segments: the intra-day, the swing and the position trade.
STRATEGY TIME FRAMES
The time frames that we will be focusing here are the daily, 4-hour, and hourly. However, you can simply adopt this strategy on any time frames that suit you best.
STRATEGY ASSUMPTIONS
This strategy assumes that you
- are familiar in identifying general trend direction,
- are familiar in identifying key support and resistance levels,
- have a basic understanding of structure levels - Higher High (HH), Higher Low (HL), Lower High (LH), Lower Low (LL), and
- have a basic understand of fibonacci retracement and extensions.
INDICATORS - FRACTALS
Many people believe that the markets are random. However, many others argue that although prices may appear to be random, they do in fact follow a pattern in the form of trends. One of the most basic ways in which traders can determine such trends is through the use of fractals. Fractals essentially break down larger trends into extremely simple and predictable patterns.
WHAT ARE FRACTALS?
A type of pattern used in technical analysis to predict a reversal in the current trend. A fractal pattern consists of five bars and is identified when the price meets the following characteristics:
- A shift from a downtrend to an uptrend occurs when the lowest bar is located in the middle of the pattern and two bars with successively higher lows are positioned around it.
- A shift from an uptrend to a downtrend occurs when the highest bar is located in the middle of the pattern and two bars with successively lower highs are positioned around it.
THINGS TO CONSIDER
Here are a few things to remember when using fractals:
- They are lagging indicators. They are best used as confirmation indicators to help confirm that a reversal did take place. Real-time tops and bottoms can be surmised with other techniques.
- The longer the time period (i.e. the number of bars required for a fractal), the more reliable the reversal. However, you should also remember that the longer the time period, the lower the number of signals generated.
- It is best to plot fractals in multiple time frames and use them in conjunction with one another. For example, only trade short-term fractals in the direction of the long-term ones. Along these same lines, long-term fractals are more reliable than short-term fractals.
- Always use fractals in conjunction with other indicators or systems. They work best as decision support tools, not as indicators on their own.
CONCLUSION
As you can see, fractals can be extremely powerful tools when used in conjunction with other indicators and techniques. Overall, fractals make excellent decision support tools for any trading method.
STRATEGY FRACTALS
For this strategy, we will be using fractals in multiple time frames - the daily and 4-hour.
STRATEGY GUIDELINES
- On the daily time frame, identify the overall trend.
- Identify the key support and resistance levels.
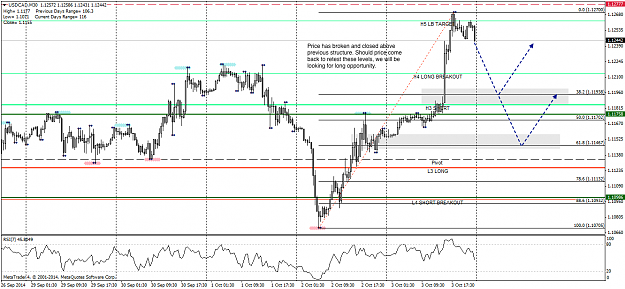
- When price break and close above/below the nearest top/bottom fractal, draw a horizontal line along that level.
A break and close above the nearest top fractal gives us a bullish bias.
A break and close below the nearest bottom fractal gives us a bearish bias. - When the overall trend and the fractal break both have the same bias, the sentiment in that direction is considered as strong.
- With that sentiment determined, zoom in to the 4-hour and/or hourly time frame to identify potential entry, stops and take profit levels.
- Identify confluences using fibonacci retracement in relation to the recent structure levels and the fractal break level for potential entry levels.
Key fibonacci retracement levels include the 38.2%, 61.8% and 78.6%. - Stops will be placed below/above the nearest structure level.
- Identify potential take profit levels using fibonacci extensions in relation to the recent structure levels and previous support/resistance levels.
Key fibonacci extension levels include the 127.2%, 141.4%, and 161.8%.
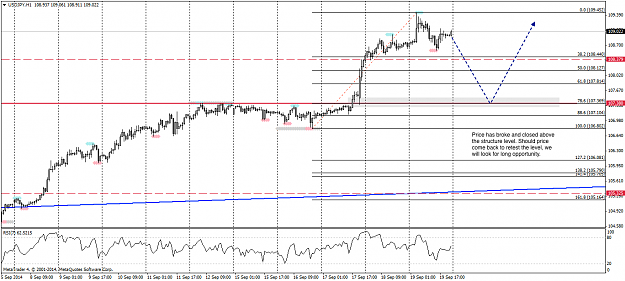
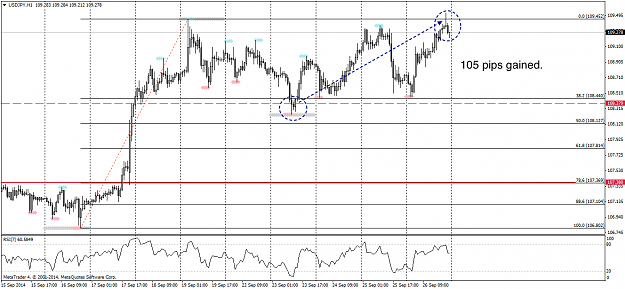
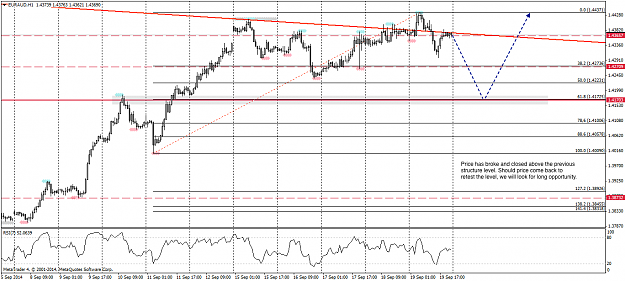
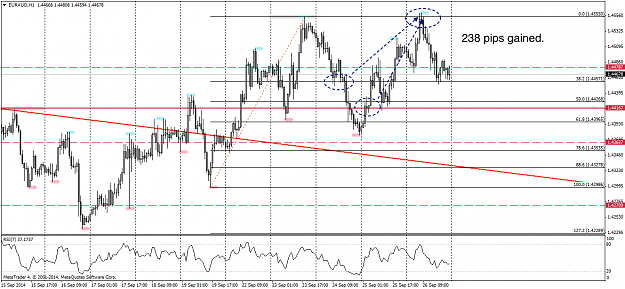
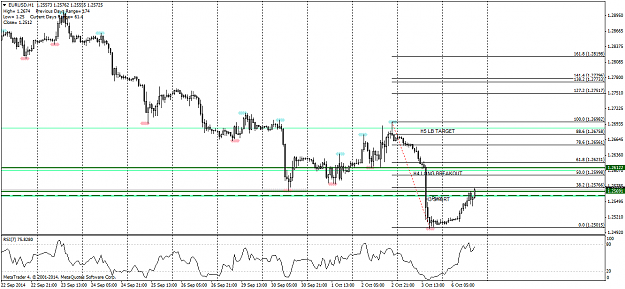
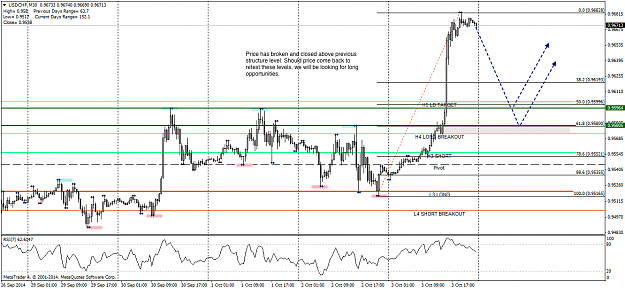
LONG TRADE EXAMPLES
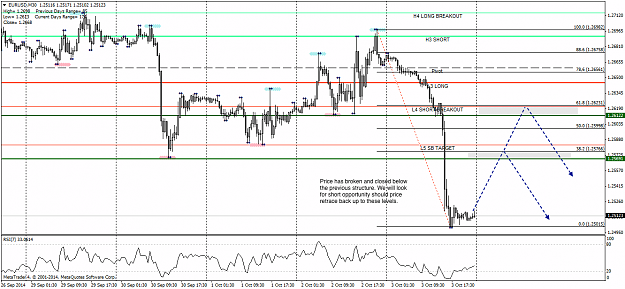
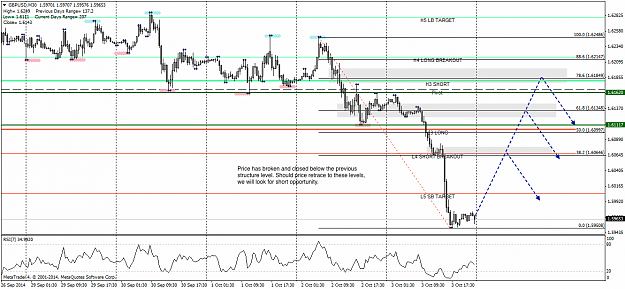
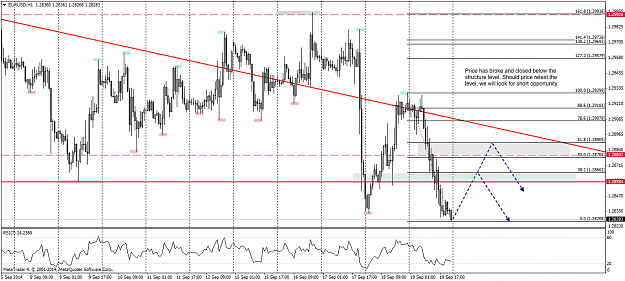
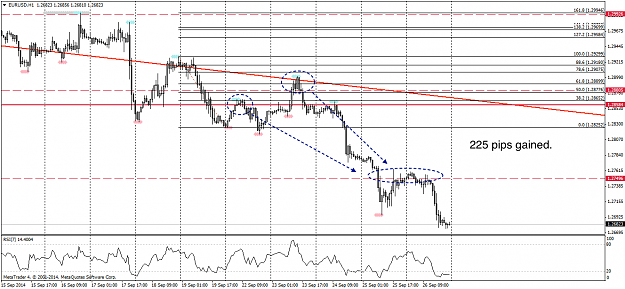
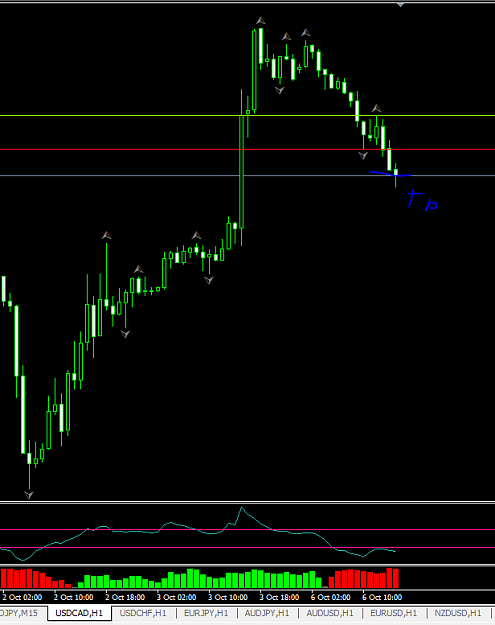
SHORT TRADE EXAMPLES