►►Financial Markets Observatory Lab.◀◀
❖ H! ALL ❖
Some notes/charts about CBOE VIX Indicator.
http://www.cboe.com/micro/VIX/images/VIX-115x100.gif
General stocks-benchmarks as follows:
► main U.S. stocks-benchmarks (charts & notes: QQQ; ONEQ; DIA; OEF; SPY);
► global U.S. stocks-benchmarks (charts & notes: EUSA; ISI; IWB; IWV; IYY; TMW);
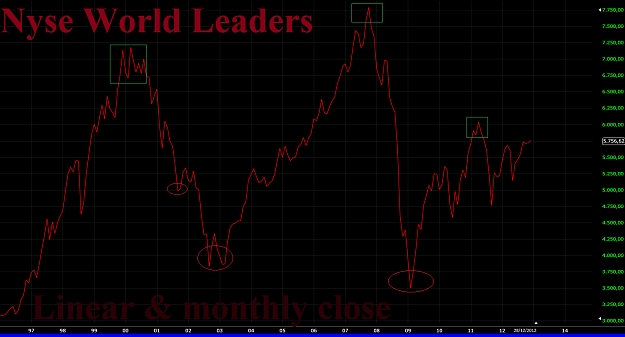
► global World stocks-benchmarks (charts & notes: ACWI; DGT; IOO; NYSE W.L.I.; ONEF; VT).
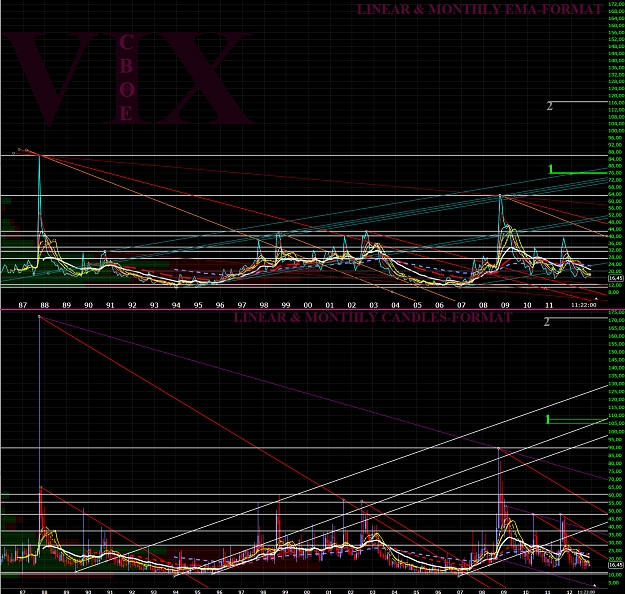
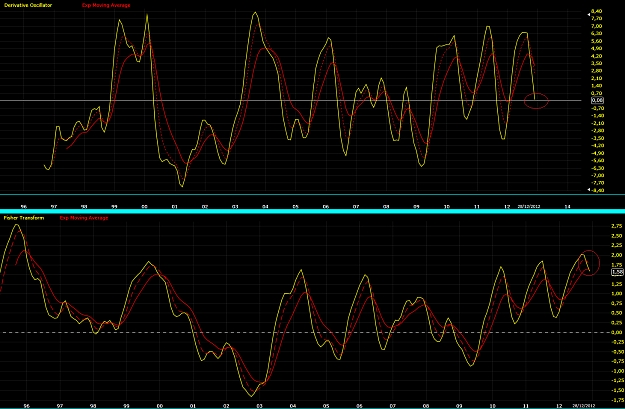
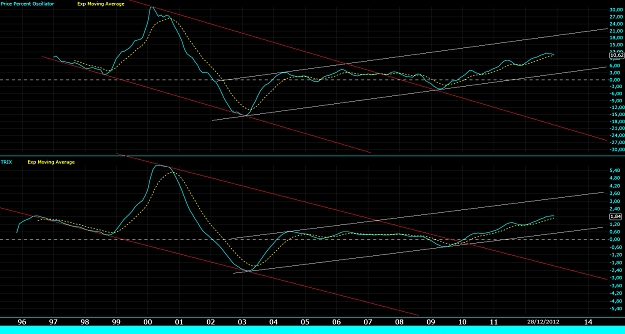
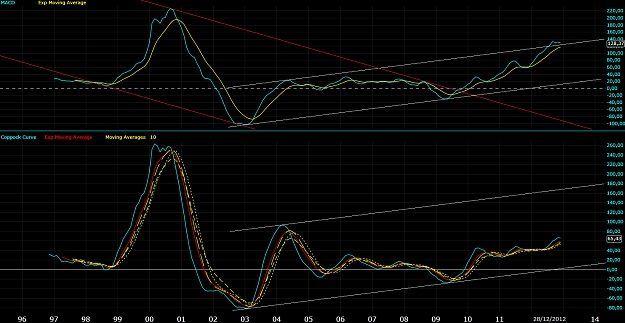
❖ VIX charts.
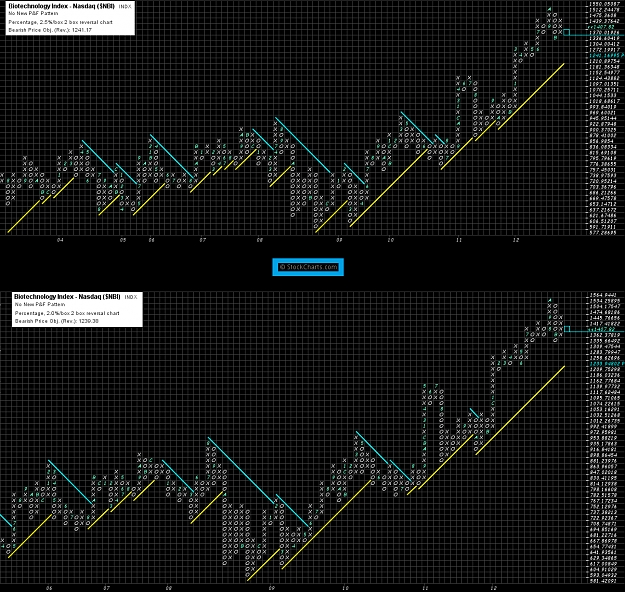
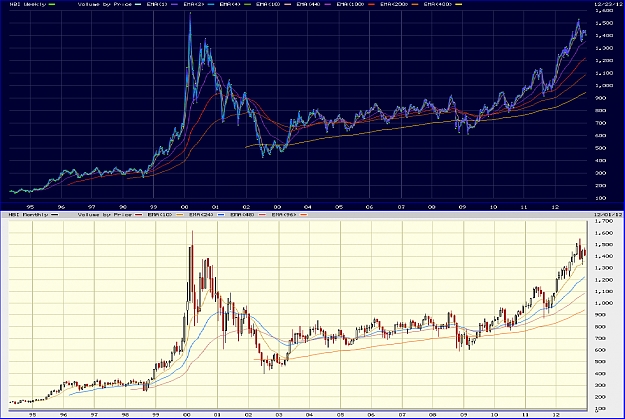
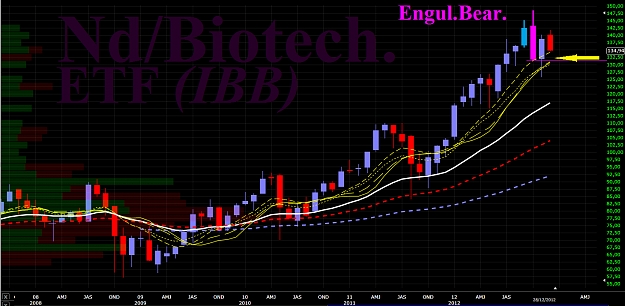
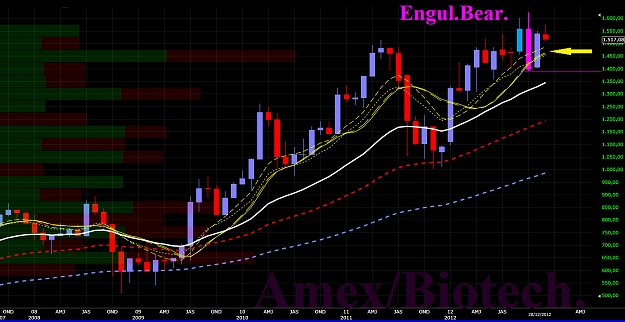
❖ Previous charts/studies of some CBOE indicators (1mo.): S&P/500 -- S&P/100 -- DJIA/30 & R2k -- EuStoxx & DAX -- European Volatility -- Japan Volatility -- S.Korea Volatility -- India & S.Africa -- Asian Volatility -- Nd/100 -- QQQ -- Single Stocks -- V-VIX --BuyWrite Ind.[ A, B, C, D, E, F ].
The main graphical elements are the followings:
-) historical top in 1987 with a Pyroclastic-spike; but II historical top in 2008, with ascending-array of price-evolution '98-'08 !!!
-) a little ascending structure based on key lows of '90 & '00, as we can see in particular from monthly ema-format;
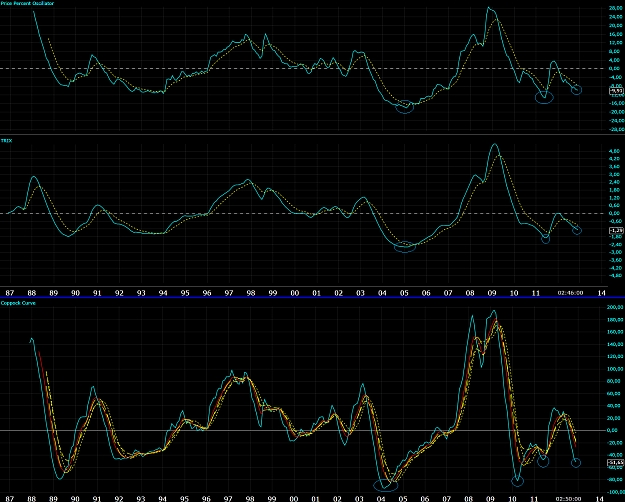
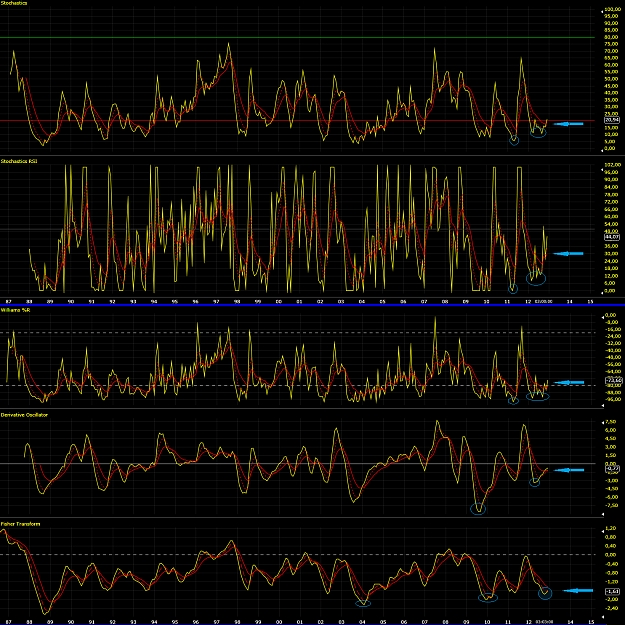
-) there are some bullish divergences between VIX and oscillators in the attached charts;
-) prices are again above (now in full descending test) the horizontal gray lines on ema-format, the markers of full relaxed structure for this indicator in this format;
-) the total price-space of indicator shows a first important FIBS-test in 1997/1998 and 2001/2002 at 0.236FIB (see also 2010/2011); moreover in 2008 we can se a full test of 0.500FIB !!! the next is 0.618 (???);
-) prices are again below the Quadruple 10mo. average (yellow-lines: sma, ema, fwma, vwma), a structural bear-array of curve; in ema-format we can se an important divergence between S&P500 tops vs. VIX lows in 2011/2012.
-) 0.500FIB (= top of 2008) is a theoretical GraphicalƉetonator or neck of a monster-cup, with a theoretical graphical target as gray-lines;
-) two other cups are in progress to obtain the theoretical graphical target: cup of decade '90, cup of decade '00 (targets as gree 1-lines).
There are some sign of important financial stress inside this curve.
According to oscillators, VIX shows some signs of next bullish phase, in the quarter I of 2013, with a possible reversal-attempt of main trend of US stocks-market in 2013.
Only price above the top-zone 1997/1998/2001/2002/2012, can cause a re-start of the giant triple-cup.
The game of the triple-cup is stopped if prices go below the 4-lows of 2008/2010/2011/2012 (see also the horizontal gray lines on ema-format), with a possible MeltDown of indicator (see also the ''inside structures'').
An alert sign is the curve (ema-format) above the 10mo. averages.
Sorry for my bad English. I hope that this post is at least minimally useful.
☻/♪ ❖ EARTH.pk, Alert 2.O !!! ❖
/▌
/|
Tuned on main trend, but follows short-medium term signs from underlying prices, for a correct & real-time set-up.
It is very important do not anticipate the main trend of the underlying financial instruments.
ⒾM☢ ℬy $@❣♆¥ ►►♥
K€$ADDhAPhA'pe'KAMPA': Bunda-Bunda €MP¥R€ ❣❣❣
http://www.bloomberg.com/apps/chart?...%3AIND&img=png
Attached Image(s) (click to enlarge)