hey guys,
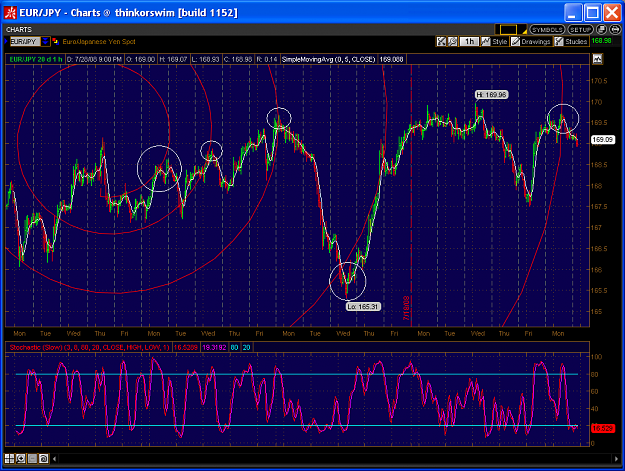
Does anybody know how to correctly chart the Fibonacci spiral, or any logarithmic spiral for that matter?
I'm a big fan of Fibonacci numbers, and I've seen their power in the markets. I don't think it's a coincidence, as the Fibo numbers represent the intersection between human/natural interaction and mathematics, and human tendency is a sizable market factor.
That being said, the Fibonacci ratios that people trade only represent vertical movements. From this, I think it follows: if the price is moving vertically based on a said sequence, that sequence should also allow for proportional horizontal moves. In other words, if there are vertical moves based on fibo ratios, then there should be horizontal moves based on them as well...or at least roughly I've found that a pure fibonacci time series isn't overly accurate though.
I've read about the spiral and people who trade by it say it is the most accurate item to correlate both price and time movements. However, the key to the spiral is where to put the center, and there is minimal literature on the subject. I'm not sure if that's because it doesn't work or works too well.
Could anybody shed some light on properly charting this? Do I need some kind of logarithmic chart?
Many thanks
Does anybody know how to correctly chart the Fibonacci spiral, or any logarithmic spiral for that matter?
I'm a big fan of Fibonacci numbers, and I've seen their power in the markets. I don't think it's a coincidence, as the Fibo numbers represent the intersection between human/natural interaction and mathematics, and human tendency is a sizable market factor.
That being said, the Fibonacci ratios that people trade only represent vertical movements. From this, I think it follows: if the price is moving vertically based on a said sequence, that sequence should also allow for proportional horizontal moves. In other words, if there are vertical moves based on fibo ratios, then there should be horizontal moves based on them as well...or at least roughly
I've read about the spiral and people who trade by it say it is the most accurate item to correlate both price and time movements. However, the key to the spiral is where to put the center, and there is minimal literature on the subject. I'm not sure if that's because it doesn't work or works too well.
Could anybody shed some light on properly charting this? Do I need some kind of logarithmic chart?
Many thanks