DislikedYou draw a 10 pip box and 2 box reversal, 24/5 by hand?
Which timeframe do you use to get the data from and do you use close values or high/low of each closed bar...Ignored
I get the data from the tick-chart.
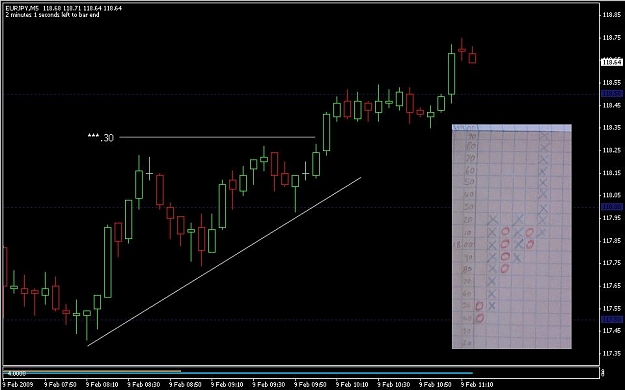
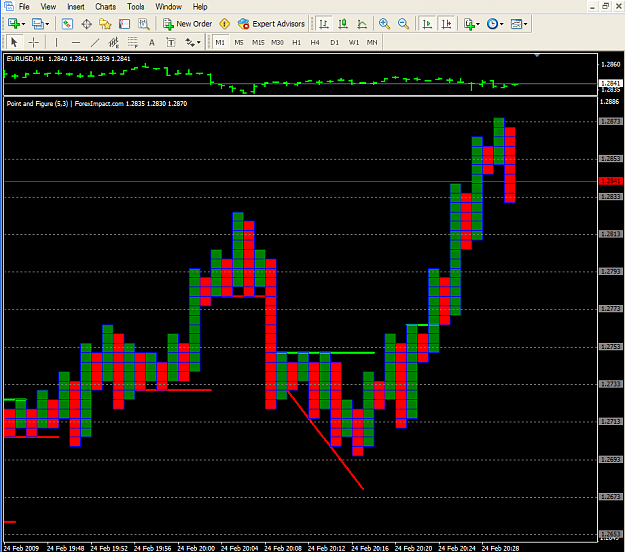
Attached is a trade I took a while ago. The main chart is there to show the candle representation. I wasn't watching this. I constructed the PnF from the tick.
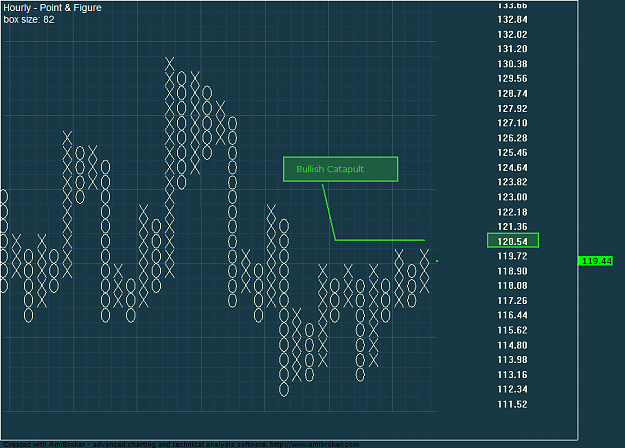
Interesting point: I got out of this trade for a few pips as price drifted along sideways after entry (break above .30 level). A PnF chart abstracts out time and so had I followed PnF only here I might have stayed in for what was ultimately a 200 pip move with little pullback.
Magnus
Attached Image (click to enlarge)