Kharvell,
One strategy that I have been using for entry (I bracket the 10pm EST sideways market, when available) is to enter the market with 2 units. I set one with a limit that is the same distance from the enterance and the stop. I set the other unit with the same stop and no limit. If the price goes in the intended direction for 30 pips and hits my limit on unit one then turns around and goes back down 60 pips and hits the stop on the other unit I brake even. However if it continues in the original direction then I'm left with one trending unit and an additional 30 pips already banked. Occasionally if it is a strong move I will move my stop to brake even after the limit is hit so the worst I can do is +30 pips.
Stop loss size depends on the currency pair.
Does this make sense?
If both units get stoped out I loose 60 pips.
First of all i would like to thank you for sharing your trading method. It seems to be easy but in the same time very profitable and accurate. My question is when is the moment of entry? In the same candle in which the magic number is reached or the next candle after the magic number have been reached.(of course if the RSI is not pointing right we will wait for the next candle) Hope I made myself understood taking in to account that English is not my mother tongue.
Thnx again for sharing your ideas.
Ignored
Hi there,
May I ask what is your "mother tongue"? I would say your English is very good!
To answer your question, entry will be at the magic number and beyond, as long as the RSI says it's OK and it hasn't been more than 3 days. It could be today, tomorrow, 2 days, etc..
Quote
Disliked
What do you place your lines with at the limit, high, and magic number?
I just draw my own trendlines using oanda's poor charting package.
FiboFan,
I will get to your question when I have a bit more time.
Kevin
First of all I would like to thank you for the quick and comprehensive answer. Now the entire picture is clear (I guess :-) ) . To answer your question my native language is Romanian.
Thank you again for sharing your method and the patience that you have shown to all of us.
In order to go long, a Pivot Low should be in place; the last pivot low which I can see has been on the 11th Jan and you should have gone long on the 12th.
The method which you are trying to implement is "the break of previous day's high" which is a different issue.
Of course kevin will explain the situation as he is the author.
Ignored
Think i missed something along the way here what or how are u getting this pivot low would 1.9590 area not be considered a pivot low ?
Kharvell,
One strategy that I have been using for entry (I bracket the 10pm EST sideways market, when available) is to enter the market with 2 units. I set one with a limit that is the same distance from the enterance and the stop. I set the other unit with the same stop and no limit. If the price goes in the intended direction for 30 pips and hits my limit on unit one then turns around and goes back down 60 pips and hits the stop on the other unit I brake even. However if it continues in the original direction then I'm left with one trending unit and an additional 30 pips already banked. Occasionally if it is a strong move I will move my stop to brake even after the limit is hit so the worst I can do is +30 pips.
Stop loss size depends on the currency pair.
Does this make sense?
If both units get stoped out I loose 60 pips.
(1 unit is whatever size lot you use)
Ignored
Hey FiboFan,
Thanks for sharing your entry strategy! I really like it! It's a good way of ensuring that you will make some good pips! I also like how the T/P differs depending on where the pivot point S/L is. I guess we have different plans of "diversification". My idea of ensuring that losses were offset was to trade 4 currency pairs, and your idea involves multiple trades in one, maybe even more pairs. I'm interested in the success you've had with this method, i.e. # of times BOTH STOPPED OUT for losses vs break evens and $$$ RIDES ! Let me know, and thanks again!
Quote
Disliked
First of all I would like to thank you for the quick and comprehensive answer. Now the entire picture is clear (I guess :-) ) . To answer your question my native language is Romanian.
Thank you again for sharing your method and the patience that you have shown to all of us.
THANK YOU! You are too kind, really! Now go make some PIPS!!! Good luck
Quote
Disliked
Think i missed something along the way here what or how are u getting this pivot low would 1.9590 area not be considered a pivot low ?
Ok, I thought of a new way maybe to ensure understanding pivots:
Pivots are alternating. With that being said, you can't have another low pivot until you have a high pivot. So we had a low pivot on Jan 10th, this indicates to look for a high pivot. As you can see, the high's just keep goin' up! Therefore, no high pivot QUITE YET, meaning NO LOW PIVOT YET
Joined Dec 2006
|
Status: call me Kevin
|1,263 Posts
Realized I haven't let you guys know my trades in a while. Some of these are questionable at best as far as my entries go. I believe I have gone astray from my own method, but luckily am still profiting. In the future, I will use more analyzing because all of these were hastily executed at incorrect entries. I've also noticed that my stops are incorrect, too. The alternating pivot point thought I mentioned above is extremely important. Anyway, here are my trades:
Long GBP/USD @ 1.9643 S/L 1.9606 = 71 PIPS
Long AUD/JPY @ 94.87 S/L 94.42 = 16 PIPS
Long USD/JPY @ 120.68 S/L 120.18 = -6 PIPS
And it looks like USD/CHF is going to be a while, but if I were you, I would maybe look into entering the next trade with me But then again, I am me, and you are you, so just do what you want to do.
Ok, I thought of a new way maybe to ensure understanding pivots:
Pivots are alternating. With that being said, you can't have another low pivot until you have a high pivot. So we had a low pivot on Jan 10th, this indicates to look for a high pivot. As you can see, the high's just keep goin' up! Therefore, no high pivot QUITE YET, meaning NO LOW PIVOT YET
Hope this is clear.
Kevin
Ignored
Soooo your looking for a new lower high to find a new higher low pivot ? Or the reverse would be a new higher low to find a lower high pivot ! Think that makes sense or else i'm just totally confusing myself and everyone else !! Suppose if you could find a chart to show what you mean it'd save a thousand words, if u have time that is ?
Soooo your looking for a new lower high to find a new higher low pivot ? Or the reverse would be a new higher low to find a lower high pivot ! Think that makes sense or else i'm just totally confusing myself and everyone else !! Suppose if you could find a chart to show what you mean it'd save a thousand words, if u have time that is ?
Ignored
Billy,
You are complicating things . I am whippin' out this chart again in hopes that you might get it. When a LOW pivot point appears like the one featured below, you will then go into HIGH pivot mode where you are watching for a high pivot. This entails looking at the high values from then on. When you find the high values are no longer increasing, this should be a red flag that it could POTENTIALLY be a high pivot. If it is indeed a high pivot, then you go into LOW pivot mode, where you look at the lows using the same process. This is what I mean by alternating High and Low pivots.
You are complicating things . I am whippin' out this chart again in hopes that you might get it. When a LOW pivot point appears like the one featured below, you will then go into HIGH pivot mode where you are watching for a high pivot. This entails looking at the high values from then on. When you find the high values are no longer increasing, this should be a red flag that it could POTENTIALLY be a high pivot. If it is indeed a high pivot, then you go into LOW pivot mode, where you look at the lows using the same process. This is what I mean by alternating High and Low pivots.
Hope this makes sense,
Kevin
Ignored
Yes i getcha now, sorry for tryna make things more complicated than they needed to be
Joined Dec 2006
|
Status: call me Kevin
|1,263 Posts
Quoting kharvell
Disliked
And it looks like USD/CHF is going to be a while, but if I were you, I would maybe look into entering the next trade with me But then again, I am me, and you are you, so just do what you want to do.
Ignored
Any gamblers out there? Strong green candle today, I went ahead and bought USD/CHF @ 1.2521
Trades:
Long GBP/USD @ 1.9643 S/L 1.9606 = 31 PIPS
Long AUD/JPY @ 94.87 S/L 94.42 = 72 PIPS
Long USD/JPY @ 120.68 S/L 120.18 = 73 PIPS
Long USD/CHF @ 1.2521 S/L 1.2416 = 2 PIPS
Congratulations on your success! I'll get back to you on that EUR/USD trade
Also, I have started a new thread aptly named RSI Daily Pivot Point System v2.0. You can find it here: http://www.forexfactory.com/showthread.php?t=13169
I did this because it will be easier for "newbies" and it is a compilation of a lot of the topics we've discussed.
Any gamblers out there? Strong green candle today, I went ahead and bought USD/CHF @ 1.2521
Trades:
Long GBP/USD @ 1.9643 S/L 1.9606 = 31 PIPS
Long AUD/JPY @ 94.87 S/L 94.42 = 72 PIPS
Long USD/JPY @ 120.68 S/L 120.18 = 73 PIPS
Long USD/CHF @ 1.2521 S/L 1.2416 = 2 PIPS
Ignored
Kharvell,
I just discovered this thread and read through all the posts last night, and thought I had your system down.
However, this post confused me. Would you explain where the pivot low is that created the buy for gbp/usd at 1.9643. I don't see it, so I must be missing something. Also, just to make sure I have this down correctly, is the stop of 1.9606 based on the low of 1/17?
Thanks for your help.
Ignored
There is an explanation for my poor trades in Post 167
This one is dedicated to Dobbie, who told me I ought to make a guide describing my methods. While theoretically I could take this system and make money off of it, I'd rather see everyone benefit. If you should so decide to claim this method as your own, so be it, and I hope you can sleep soundly at night! I would like to have credit for this though.
Just as a precursor, what this method COULD do for you after 6 months of backtesting:
GBP/USD 1903 PIPS
USD/CHF 1061 PIPS
AUD/JPY 692 PIPS
USD/JPY 891 PIPS
As of now, I have started forward testing this week and am currently up about 700 PIPS in one week, which has admittedly been just a lucky catch. If I were to use my method (which I am), I would stick to volatile pairs.. i.e. GBP/USD.
So now that you know what this system COULD do, here is HOW it works:
First, get out your handy dandy Daily Chart(GBP/USD)
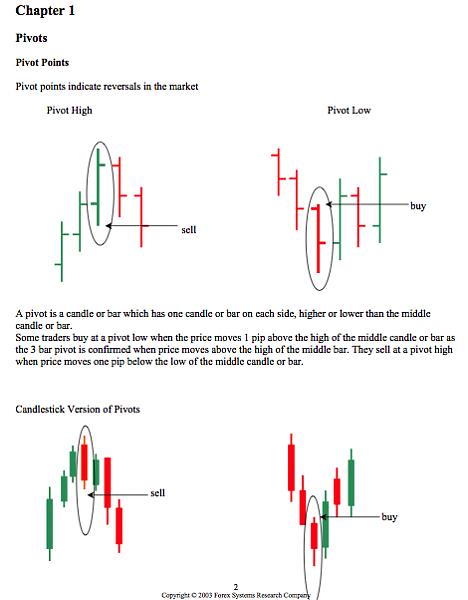
Then look for pivot points! Pretty easy, I know... But some of us may not know what pivot points look like, so let me describe them to you:
A price will hit a minimum or a maximum.
After that minimum or maximum, you must wait for the price to extend below the LOW (for maximums) and above the HIGH (for minimums). I usually use the spread.
A real world example:
GBP/USD
On November 16th, 2006 it reaches a Minimum of 1.8831
So, we observe the HIGH of that day, which happens to be 1.8966
We then add the spread to this, which for OANDA, the spread is typically 3.
Our magic number is 1.8969!
Now, the other part of my system...
RSI
Set an RSI(10) on your graph. I would draw 2 extra horizontal trendlines on your RSI at 40 and 60.
Now there are several scenarios(rules) that will indicate whether to actually buy in our real world example:
NOTE: If a BUY scenario is not reached within 3 days(3 BARS), then we do not act upon the pivot point. That is to say there are 3 bars between the MIN/MAX day and today.
If our magic number 1.8969 is reached and the RSI(10) is sloping UP, ABOVE 50, then we BUY.
If our magic number 1.8969 is reached and the RSI(10) is sloping UP,
JUST came from 30, and now ABOVE 40, then we BUY.
If our magic number 1.8969 is reached and the RSI(10) is sloping DOWN,
ABOVE 50, we do NOTHING.
Otherwise, If our magic number 1.8969 is reached and the RSI(10) is BELOW 50 we do NOTHING.
We then sell out when the next pivot point exists, EVEN if it is 2 bars later.. Again this means a MAXIMUM must develop and the next bar must not exceed it, and also go below the LOW of the MAXIMUM.
NOTE: If a new maximum develops before the pivot point happens, we keep riding!
ALSO, we set the stop loss to either the minimum that we bought near or 100 PIPS, whichever is less.
Now I assume we are all intelligent and would be able to reverse everything for a sell position, but if you have any questions feel free to ask. The only major thing is using a value of 40 instead of 60 and 30 instead of 70 for the RSI(10) scenarios.
As they say here in Texas, there's no such thing as a dumb question.
Good luck to all
Ignored
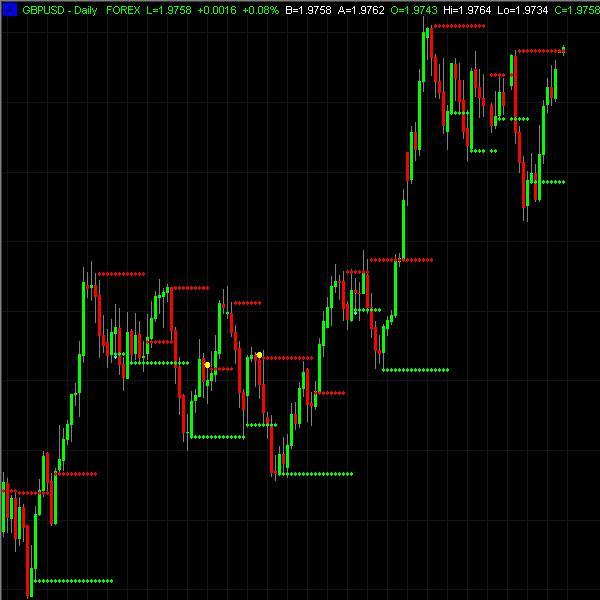
Is your name Kharkov from the tradestation forums, if so, I've been using the updated form of your indicator for some time now, really good stuff. For all TS Users, I have provided the code below. If not TS user, shouldn't be hard to translate. I have been using this in conjunction with other factors for some time with success on many timeframes. Here is a pic of daily with RSI Pivots(red and green dots added on). This latest version was done by some user named codetalker - really amazing at coding just about anything.
[LegacyColorValue = true];
{***********************************************************************
Indicator..........: Power RSI Pivot by FEDSignal.com
Destination........: Counter-Trend System
E-Mail.............: [email protected]
Last Modified Date.: 06/26/2003
Type Signals.......: Only RSI Pivot
Interval Settings..: Tick Bar, Volume Bar, TimeBar.
Aplication.........: RadarScreen 7.XX, TradeSation 7.XX
RadarScreen�, TradeSation� are registered trademarks of TradeStation Technologies, Inc.
*************************************************************************}
{
(Note: as of 10/2005, combs is now _Nemo and Orc is now Kharkov)
Orc, 6/27/2003 - posted in topic 13560
eKam, 6/29/2003 - code cleaned up
- added short signals
ekam, 7/26/2003 - plot support / resistence lines
- added reverse divergence signals
ekam, 7/30/2003 - added alerts in the style of combs and RalphP
ekam, 10/19/2005 - added alerts when S/R levels are breached
codetalker 11/28/2005 - compressed the code into a new format
}
Inputs:
Length(7),
Price((o+c)/2),
Mult(0.0005);
Inputs:
MarkPlain(False),
MarkDiver(False),
MarkRevDiver(true),
MarkSupport(true),
MarkResistance(true),
DrawHLines(true);
Variables:
k_15(15),
k_50(50),
RSIWAvg(0);
Variables:
lastRSIAtPivotLo(0),lastPriceAtPivotLo(0),lastLoAtPivotLo(0),
lastRSIAtPivotHi(0),lastPriceAtPivotHi(0),lastHiAtPivotHi(0);
{ figure out long/short threshold }
Variables:
idx(0),
RSIAvg(0),
longThreshold(0),
shrtThreshold(0),
_RSI(0);
Variables:
alertTextID(-1);
Variables:
lngDiverColor(green),
lngRSIColor(darkgreen),
lngRevDiverColor(cyan);
Variables:
srtDiverColor(red),
srtRSIColor(darkred),
srtRevDiverColor(yellow);
Variables:
PColor(0),
TextFlag(False),
AlertMsg("");
Variables:
pRSIWAvg_lThres(False),
pRSIWAvg_sThres(False);
Variables:
WasLBarRSIPivotHigh(False),
WasLBarRSIPivotLow(False),
WeAreRSIDiverL(False),
WeAreRSIDiverS(False),
WeAreRSILong(False),
WeAreRSIShort(False),
WeAreRSIDiverRevL(False),
WeAreRSIDiverRevS(False),
PlotAShortPosition(False),
PlotALongPosition(False);
_RSI = RSI(Price,Length);
RSIAvg = Average(_RSI,k_50);
RSIWAvg = WAverage(_RSI,3);
longThreshold = 60 - (100-RSIAvg)/1.68;
shrtThreshold = 40 + (RSIAvg)/1.68;
{ Common Conditions }
pRSIWAvg_lThres=RSIWAvg[1] < (longThreshold + k_15);
pRSIWAvg_sThres=RSIWAvg[1] > (shrtThreshold - k_15); // let's just calculate it once
{ Long Condition SetUps }
WasLBarRSIPivotLow= RSIWAvg[1] < RSIWAvg And CountIf(RSIWAvg[1] < RSIWAvg[2],3)=3;
WeAreRSIDiverL= pRSIWAvg_lThres and { RSI was "low enough" look for divergence }
Price < lastPriceAtPivotLo and { price was higher in last RSI pivot low, but }
LastRSIAtPivotLo < _RSI and MarkDiver; { RSI was lower => divergence }
WeAreRSILong= RSIWAvg[1] < longThreshold and MarkPlain; { no divergence, but RSI very low, and so it's worth noting }
WeAreRSIDiverRevL= pRSIWAvg_sThres AND { RSI was "high enough" } { a pivot low while RSI reading is high, look for rev divergence }
Price > lastPriceAtPivotLo AND { price was higher in last RSI pivot low, but }
LastRSIAtPivotLo < _RSI and MarkRevDiver; { RSI was lower => rev divergence }
PlotALongPosition=WeAreRSIDiverL or WeAreRSILong or WeAreRSIDiverRevL;
{ Short Condition SetUps }
WasLBarRSIPivotHigh=RSIWAvg[1] > RSIWAvg And CountIf(RSIWAvg[1] > RSIWAvg[2],3)=3; { last bar was a RSI pivot high }
WeAreRSIDiverS= pRSIWAvg_sThres and { RSI was "high enough" for a pivot high, look for divergence }
Price > lastPriceAtPivotHi and { price was higher in last RSI pivot high, but }
lastRSIAtPivotHi > _RSI and MarkDiver; { RSI was higher => divergence }
WeAreRSIShort= RSIWAvg[1] > shrtThreshold and MarkPlain; { no divergence, but RSI very high, and so it's worth noting }
WeAreRSIDiverRevS= pRSIWAvg_lThres and { RSI was "low enough" } { a pivot high while RSI reading is low, look for rev divergence }
Price < lastPriceAtPivotHi and { price was lower in last RSI pivot high, but }
lastRSIAtPivotHi > _RSI and MarkRevDiver; { RSI was higher => rev divergence }
PlotAShortPosition=WeAreRSIDiverS or WeAreRSIShort or WeAreRSIDiverRevS;
{ Let the Code flow }
If CurrentBar = 1 then AlertTextID = Text_New(date,time,0,"RSI");
{ drawing related variables }
{ long signal }
If WasLBarRSIPivotLow Then { last bar was a RSI pivot low }
Begin
If WeAreRSIDiverL Then
begin
PColor=lngDiverColor; { plot a "significant" long signal }
AlertMsg="RSI diver long";
end else
if WeAreRSILong then
begin
PColor=lngRSIColor; { plot a normal long signal }
AlertMsg="RSI long";
end else
if WeAreRSIDiverRevL Then
Begin
PColor=lngRevDiverColor;
AlertMsg="RSI rev diver long";
End;
If PlotALongPosition Then { Some long condition wants to Plot }
Begin
Plot1(L-L*mult,"long",PColor);
If Text_GetTime(alertTextID) <> time then
Begin
text_setLocation(alertTextID, date, time, 0);
alert(AlertMsg);
End;
End;
lastPriceAtPivotLo = Price;
lastLoAtPivotLo = L;
lastRSIAtPivotLo = _RSI;
End; { WasLastBarRSIPivotLow }
If DrawHLines Then
Begin
If lastLoAtPivotLo <> 0 and MarkSupport then
begin
Plot3(lastLoAtPivotLo,"lastL@pivotL");
if lastLoAtPivotLo <> lastLoAtPivotLo[1] and Text_GetTime(alertTextID) <> time then
begin
AlertMsg="RSI support";
TextFlag=True;
end;
end;
If lastHiAtPivotHi <> 0 and MarkResistance then
Begin
Plot4(lastHiAtPivotHi,"lastH@pivotH");
if lastHiAtPivotHi <> lastHiAtPivotHi[1] and Text_GetTime(alertTextID) <> time then
begin
AlertMsg="RSI resistance";
TextFlag=True;
End;
End;
End;
If Text_GetTime(alertTextID) <> time Then
Begin
If close crosses below lastLoAtPivotLo then
begin
AlertMsg="Below support";
TextFlag=True;
end Else
if close crosses above lastHiAtPivotHi then
Begin
AlertMsg="Above resistance";
TextFlag=True;
end;
End;
If TextFlag Then
Begin
text_setLocation(alertTextID, date, time, 0);
Alert(AlertMsg);
TextFlag=False;
End;
{ short signal }
If WasLBarRSIPivotHigh Then { last bar was a RSI pivot high }
Begin
If WeAreRSIDiverS Then { plot a "significant" short signal }
Begin
PColor=srtDiverColor;
AlertMsg="RSI diver short";
end else
if WeAreRSIShort then { plot a normal short signal }
begin
PColor=srtRSIColor;
AlertMsg="RSI short";
end Else
If WeAreRSIDiverRevS Then
Begin
PColor=srtRevDiverColor;
AlertMsg="RSI rev diver short";
end;
If PlotAShortPosition Then { Some short condition wants to Plot }
Begin
Plot2(H+H*mult,"short",PColor);
If Text_GetTime(alertTextID) <> time then
Begin
text_setLocation(alertTextID, date, time, 0);
Alert(AlertMsg);
End;
End;
lastPriceAtPivotHi = Price;
lastHiAtPivotHi = H;
lastRSIAtPivotHi = _RSI;
End; { WasLastBarRSIPivotHigh }
Joined Dec 2006
|
Status: call me Kevin
|1,263 Posts
Quote
Disliked
Is your name Kharkov from the tradestation forums, if so, I've been using the updated form of your indicator for some time now, really good stuff. For all TS Users, I have provided the code below. If not TS user, shouldn't be hard to translate. I have been using this in conjunction with other factors for some time with success on many timeframes. Here is a pic of daily with RSI Pivots(red and green dots added on). This latest version was done by some user named codetalker - really amazing at coding just about anything.
Nope, no relation to Kharkov, but that's interesting that his username is so similar and uses a very similar method.
THANKS for providing that code! It will be helpful to a lot of people! Does it include the RSI rules in my original method?
... Here is a pic of daily with RSI Pivots(red and green dots added on). This latest version was done by some user named codetalker - really amazing at coding just about anything.
Indicator..........: Power RSI Pivot by FEDSignal.com
Aplication.........: TradeSation 7.XX
Ignored
Hi Leugimp,
Thanks for the code. BTW, do you trade from TS7.7? New TS8.8 can not plot this indicator correctly. If you have a new version would you be so kind to upload it here (or send to me with PM)?