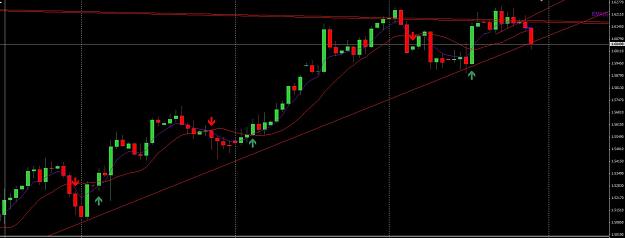
I have this daily trendline, see below picture
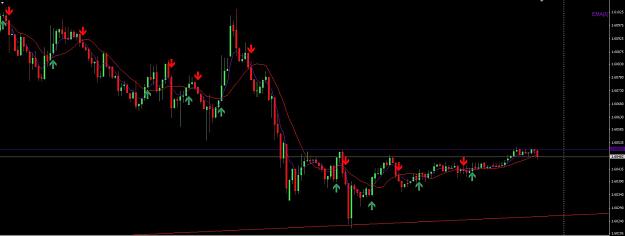
However, when I change from Daily to the 5 minute chart, I get this:
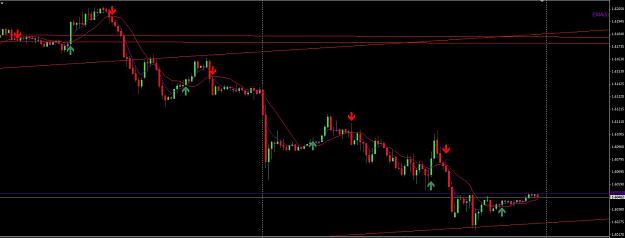
and on the 15 minute chart, I get the same thing:
It isn't until I go to the 30 minute chart that I get a dip below the trendline:
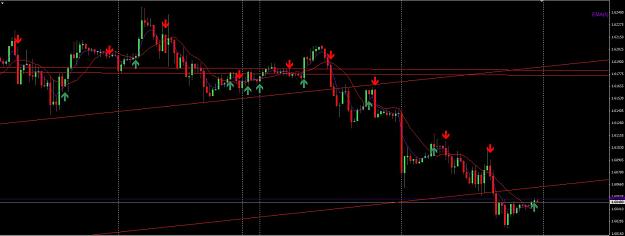
What explains this phenomena?
Attached Image (click to enlarge)
However, when I change from Daily to the 5 minute chart, I get this:
Attached Image (click to enlarge)
and on the 15 minute chart, I get the same thing:
Attached Image (click to enlarge)
It isn't until I go to the 30 minute chart that I get a dip below the trendline:
Attached Image (click to enlarge)
What explains this phenomena?