Dear all,
I have created this thread to talk about several indicators that I developed over the past years to assist me in my trading. I will use this thread to make calls based on these indicators, but before I can do so I should introduce them. Some of the concepts of the indicators are not new, some are, so I will be using several posts to explain the different components of this set of indicators. The main idea behind this set of indicators is to get an indication of the strongest support and resistance areas on the chart, WITHOUT cluttering the whole screen up with lines.
Screen real-estate is an important factor in our business, because the more tickers you put on 1 screen, the less you see price. The more indicators you drop on your ticker, the less you see price. Since I program these indicators myself, for myself, I always strive for keeping my screens as clean as possible.
I thought this might interest others, and hence this thread.
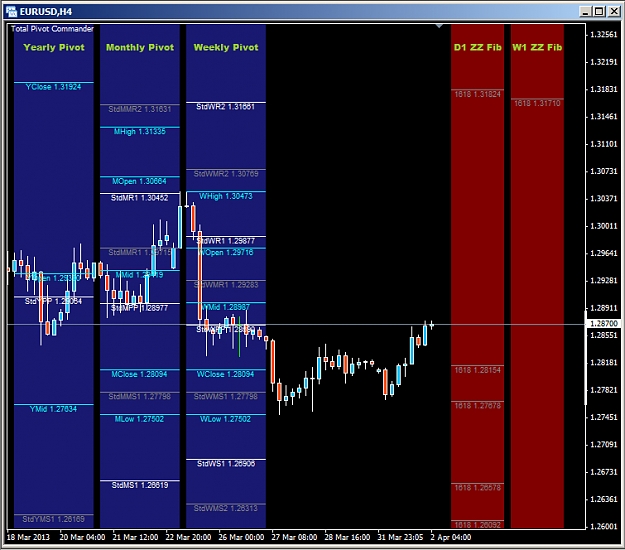
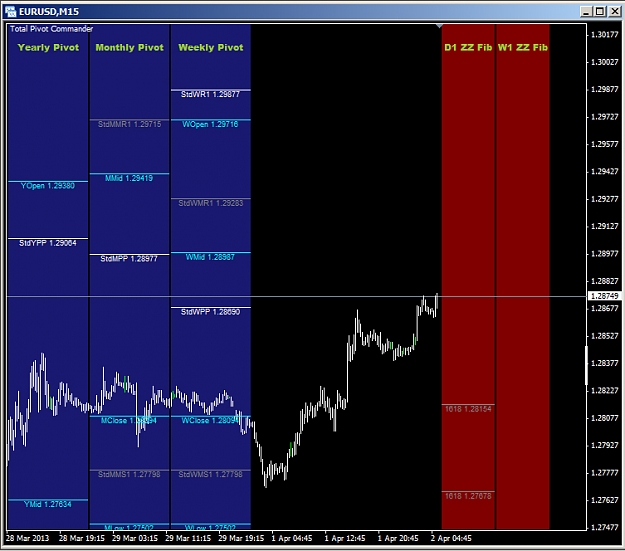
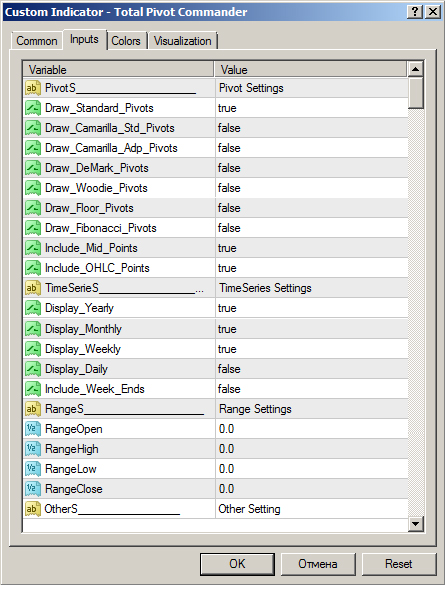
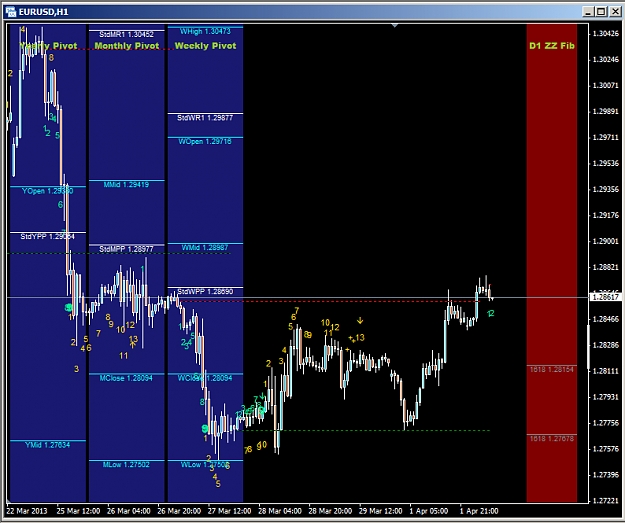
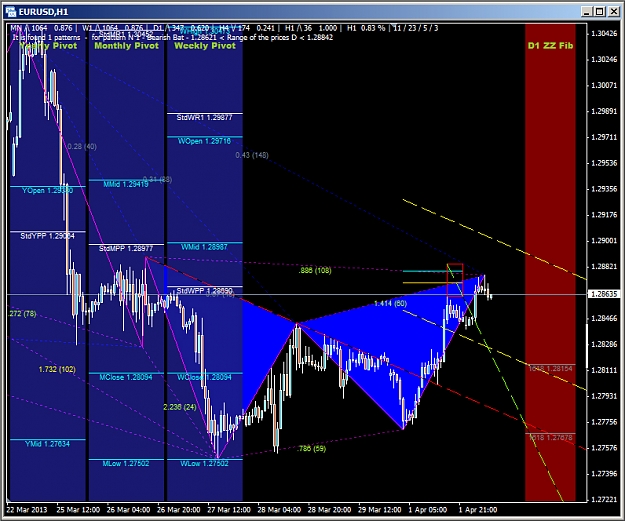
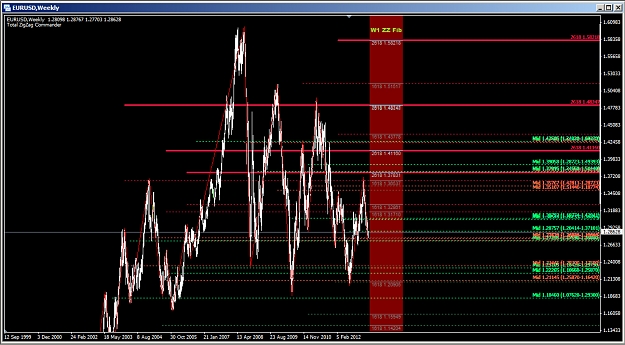
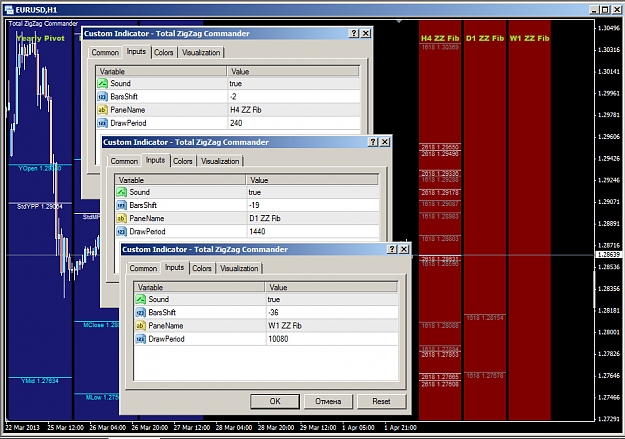
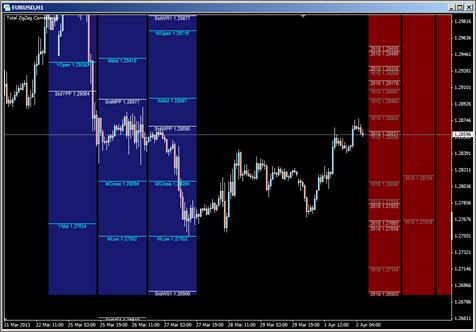
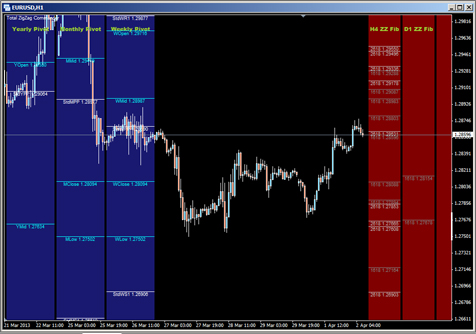
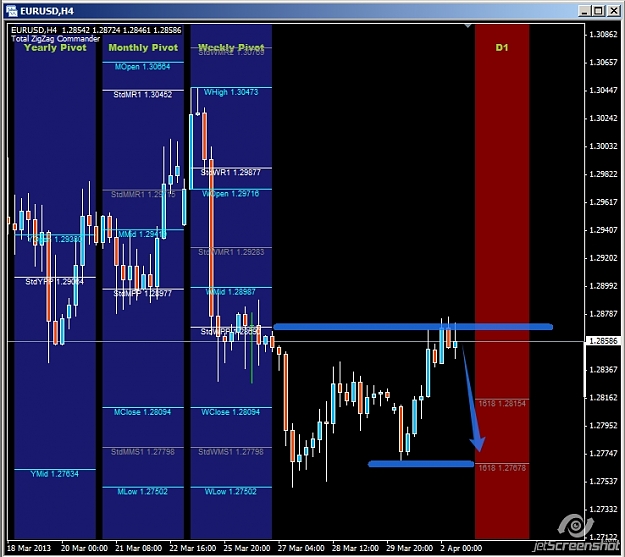
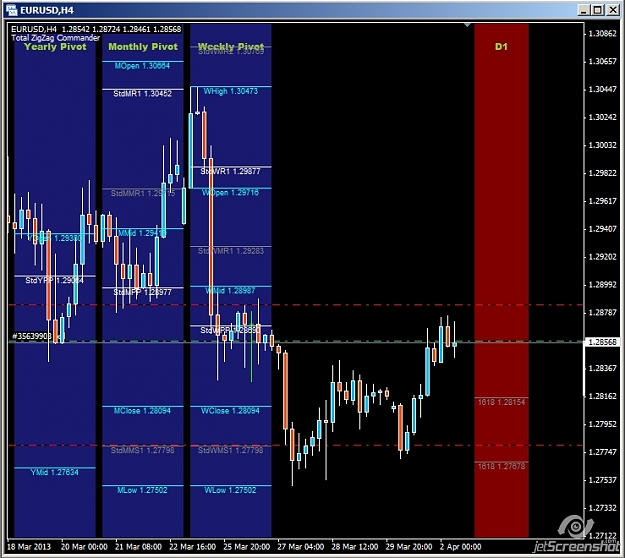
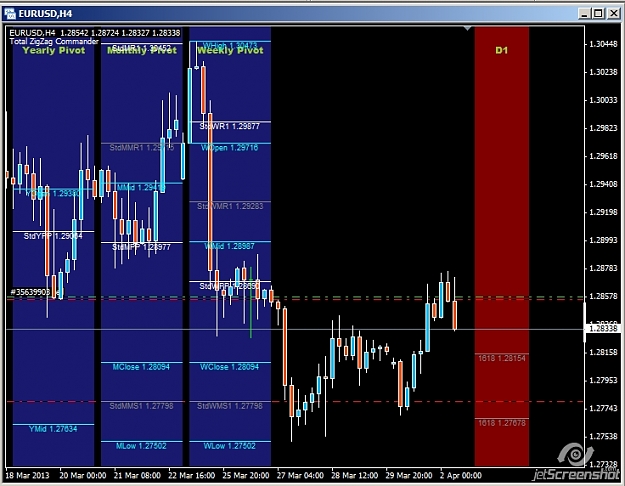
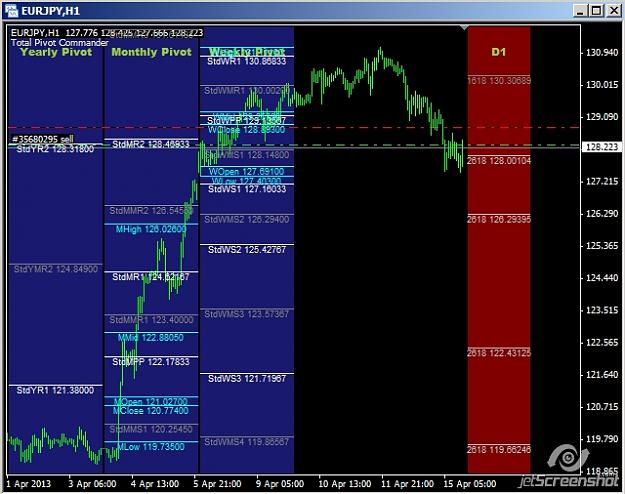
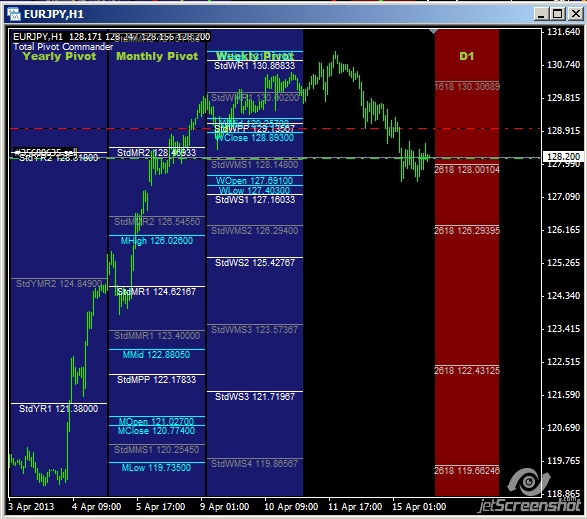
I will start with two screenshots of the main indicator I use, it is called Total Pivot Commander, that's because of the blue colored panes. It has the option to show different kinds of pivot calculations as you will see later on (Standard, Floor, Fibonacci, De Mark, Woodies, Camarilla, Free Range). Obviously you can switch on or off any calculation and any time frame you like. It has a Free Range option to calculate pivots of any range of time and price you want, be it a ZigZag, a time period not inside MetaTrader, or a future indication of pivots at a Close of your choosing. The difference in the two screenshots is only the time frame, obviously these indicators work on any time frame, just the scaling will be slightly different.
The red panes on the right are something that is often missed in trading. Most of you have probably used Fibonacci Retracements, but rarely does one keep retracements of all previous ZigZags on the timeframe. The red panes on the right display the 1.618 and 2.618 retrace levels of ALL ZigZags of the particular timeframe of the pane. These levels are very strong support and resistance, and mostly overlooked by traders. I will use future posts to this thread to visually explain this concept again in more detail.
For now, thank you for visiting this thread, I wish you many green pips in trading!
I have created this thread to talk about several indicators that I developed over the past years to assist me in my trading. I will use this thread to make calls based on these indicators, but before I can do so I should introduce them. Some of the concepts of the indicators are not new, some are, so I will be using several posts to explain the different components of this set of indicators. The main idea behind this set of indicators is to get an indication of the strongest support and resistance areas on the chart, WITHOUT cluttering the whole screen up with lines.
Screen real-estate is an important factor in our business, because the more tickers you put on 1 screen, the less you see price. The more indicators you drop on your ticker, the less you see price. Since I program these indicators myself, for myself, I always strive for keeping my screens as clean as possible.
I thought this might interest others, and hence this thread.
I will start with two screenshots of the main indicator I use, it is called Total Pivot Commander, that's because of the blue colored panes. It has the option to show different kinds of pivot calculations as you will see later on (Standard, Floor, Fibonacci, De Mark, Woodies, Camarilla, Free Range). Obviously you can switch on or off any calculation and any time frame you like. It has a Free Range option to calculate pivots of any range of time and price you want, be it a ZigZag, a time period not inside MetaTrader, or a future indication of pivots at a Close of your choosing. The difference in the two screenshots is only the time frame, obviously these indicators work on any time frame, just the scaling will be slightly different.
The red panes on the right are something that is often missed in trading. Most of you have probably used Fibonacci Retracements, but rarely does one keep retracements of all previous ZigZags on the timeframe. The red panes on the right display the 1.618 and 2.618 retrace levels of ALL ZigZags of the particular timeframe of the pane. These levels are very strong support and resistance, and mostly overlooked by traders. I will use future posts to this thread to visually explain this concept again in more detail.
For now, thank you for visiting this thread, I wish you many green pips in trading!
Attached Image(s) (click to enlarge)