GBPNZD 20 min
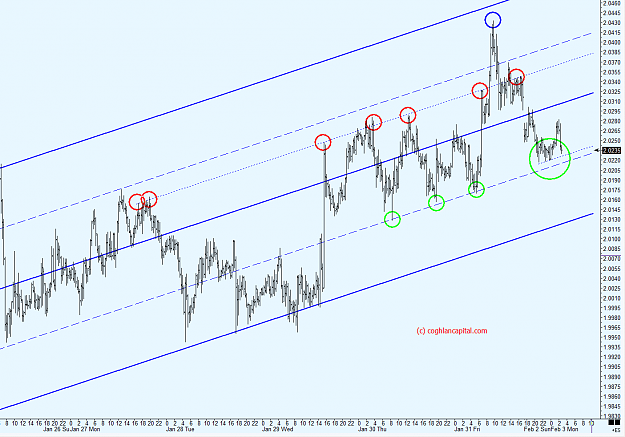
[highlight=rgb(244, 246, 249); color:rgb(0, 0, 0); font-family:verdana,helvetica,sans-serif]Another 20 min chart I have been following is the GBPNZD where I have drawn a Modified Schiff pitchfork from the low on 14th January. Median Line Analysis using pitchforks allows us to follow the path of price very accurately and to make use of perceived area of support and resistance for high-probability, low-risk trades.[/highlight]
[highlight=rgb(244, 246, 249); color:rgb(0, 0, 0); font-family:verdana,helvetica,sans-serif]In this instance validation of the pitchfork - and the correct path of price - came form the red circled touches on the Upper and Lower Parallels and we could use this confidence to look for trades along the lines of the pitchfork.[/highlight]
[highlight=rgb(244, 246, 249); color:rgb(0, 0, 0); font-family:verdana,helvetica,sans-serif]For example a long taken on the second bar of the double-tap in the green circle at 1.9995 could have been entered with a stop below the first bar of approximately 10 points. This low-risk entry would have yielded several hundred points as price topped out at the Sliding Parallel marked by the red arrow at about 2.0280. The Sliding Parallel was drawn once price had dipped the first time on failing to reach the quartile above......[/highlight]
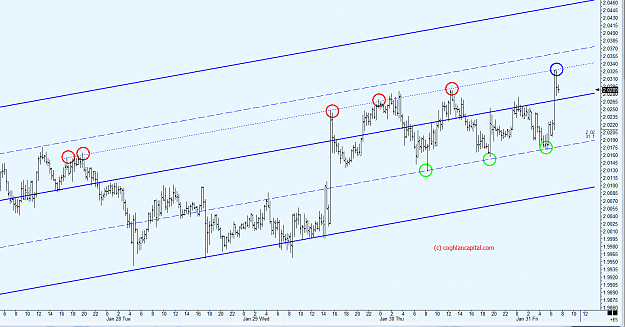
EDIT[highlight=rgb(244, 246, 249); color:rgb(0, 0, 0); font-family:verdana,helvetica,sans-serif] - The second chart shows a possible trade since I first posted about this vehicle - entry along proven support at the third green circled Quartile touch at 2.0170 with a ten point stop and closed at the blue circle along confirmed Sliding Parallel resistance at 2.0325. EDIT 2 - the high on the move was 2.0404, a spectacular intraday move from the Quartile entry.........[/highlight]
[highlight=rgb(244, 246, 249); color:rgb(0, 0, 0); font-family:verdana,helvetica,sans-serif]To find out more about our services, please follow this link:[/highlight]
[highlight=rgb(244, 246, 249); color:rgb(0, 0, 0); font-family:verdana,helvetica,sans-serif]http://affiliate.coghlancapital.com/...C4wLjAuMC4wLjA[/highlight]
[highlight=rgb(244, 246, 249); color:rgb(0, 0, 0); font-family:verdana,helvetica,sans-serif]You may also be interested in a recent Webinar which is linked below:[/highlight]
[highlight=rgb(244, 246, 249); color:rgb(0, 0, 0); font-family:verdana,helvetica,sans-serif]http://www.coghlancapital.com/node/7723[/highlight]
[highlight=rgb(244, 246, 249); color:rgb(0, 0, 0); font-family:verdana,helvetica,sans-serif]email: [email protected][/highlight]
[highlight=rgb(244, 246, 249); color:rgb(0, 0, 0); font-family:verdana,helvetica,sans-serif]This thread relates to the Cross Pair Analysis service at Coghlan Capital. The service provides members with detailed daily analysis of approximately 20 non-US Dollar pairs and is a proven method designed to provide a framework for them to take their own low-risk, high-probability trades.[/highlight]
[highlight=rgb(244, 246, 249); color:rgb(0, 0, 0); font-family:verdana,helvetica,sans-serif]Another 20 min chart I have been following is the GBPNZD where I have drawn a Modified Schiff pitchfork from the low on 14th January. Median Line Analysis using pitchforks allows us to follow the path of price very accurately and to make use of perceived area of support and resistance for high-probability, low-risk trades.[/highlight]
[highlight=rgb(244, 246, 249); color:rgb(0, 0, 0); font-family:verdana,helvetica,sans-serif]In this instance validation of the pitchfork - and the correct path of price - came form the red circled touches on the Upper and Lower Parallels and we could use this confidence to look for trades along the lines of the pitchfork.[/highlight]
[highlight=rgb(244, 246, 249); color:rgb(0, 0, 0); font-family:verdana,helvetica,sans-serif]For example a long taken on the second bar of the double-tap in the green circle at 1.9995 could have been entered with a stop below the first bar of approximately 10 points. This low-risk entry would have yielded several hundred points as price topped out at the Sliding Parallel marked by the red arrow at about 2.0280. The Sliding Parallel was drawn once price had dipped the first time on failing to reach the quartile above......[/highlight]
EDIT[highlight=rgb(244, 246, 249); color:rgb(0, 0, 0); font-family:verdana,helvetica,sans-serif] - The second chart shows a possible trade since I first posted about this vehicle - entry along proven support at the third green circled Quartile touch at 2.0170 with a ten point stop and closed at the blue circle along confirmed Sliding Parallel resistance at 2.0325. EDIT 2 - the high on the move was 2.0404, a spectacular intraday move from the Quartile entry.........[/highlight]
[highlight=rgb(244, 246, 249); color:rgb(0, 0, 0); font-family:verdana,helvetica,sans-serif]To find out more about our services, please follow this link:[/highlight]
[highlight=rgb(244, 246, 249); color:rgb(0, 0, 0); font-family:verdana,helvetica,sans-serif]http://affiliate.coghlancapital.com/...C4wLjAuMC4wLjA[/highlight]
[highlight=rgb(244, 246, 249); color:rgb(0, 0, 0); font-family:verdana,helvetica,sans-serif]You may also be interested in a recent Webinar which is linked below:[/highlight]
[highlight=rgb(244, 246, 249); color:rgb(0, 0, 0); font-family:verdana,helvetica,sans-serif]http://www.coghlancapital.com/node/7723[/highlight]
[highlight=rgb(244, 246, 249); color:rgb(0, 0, 0); font-family:verdana,helvetica,sans-serif]email: [email protected][/highlight]
[highlight=rgb(244, 246, 249); color:rgb(0, 0, 0); font-family:verdana,helvetica,sans-serif]This thread relates to the Cross Pair Analysis service at Coghlan Capital. The service provides members with detailed daily analysis of approximately 20 non-US Dollar pairs and is a proven method designed to provide a framework for them to take their own low-risk, high-probability trades.[/highlight]
Attached Image(s) (click to enlarge)

Attached Image