Short introduction
Eighty years ago, Hosoda Goichi, a Japanese journalist, begins to develop a technique for analyzing the market and, after about thirty-eight years of training, in 1968 reveals a system that translated literally means: "one glance equilibrium chart", which the Western world would be known only in the 90s.
What makes it unique in the world of abundant in oscillators, is that his performance shows a more accurate vision of what is happening on chart, so setups that have high probability of development, on short, medium and long term, is clearly distinguishable from those with a very small probability.
Structure
Based on pure price-action , Ichimoku is calculated in a similar fashion with Moving Average, represents a more advanced graphics by the five studies) with it contains and which I will take turns and I will present as follows (Default configuration: 9, 26, 52) :
Tenkan-sen and the turning line
Is computed using the formula: (the highest peak (high) + The lower base (bottom) )/ 2 - for the last nine periods.
Kijun-sen or standard line
Is computed using the formula: (The highest peak (high) + The lower base (bottom)) / 2 - for the last 26 periods.
Chikou Span or the lagging line
Is calculated as: current closing price projected back in the past 26 periods
Senkou Span A or first leading line
It is calculated by the formula: (Tenkan-sen + Kijun-sen)/2 projected on 26 periods in the future.
Senkou Span B or the second leading line
It is calculated by the formula: (The highest peak (high) + The lower the (Bottom)) / 2 - for the last 52 times, projected 26 periods in the future.
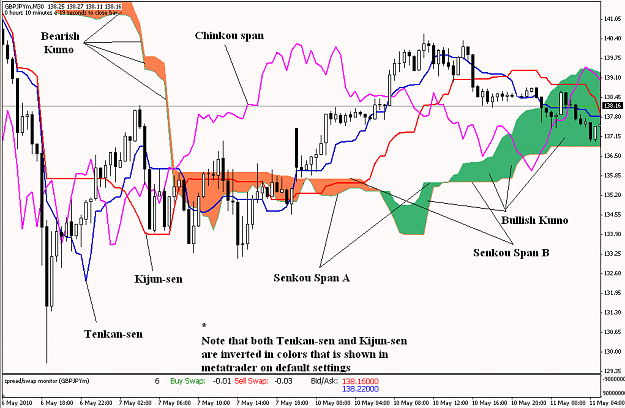
The notion of Kumo (cloud) is represented by two indicators Senkou Senkou Span A and Span B, united in a "band" with a fill effect, while other indicators: Tenkan-sen-sen and Chikou Kijun Spain are represented by individual separated lines.
Features
As a tool for more exotic analyses, it could show your current momentum, the general trend, speed of trend, dynamic supports and resistances, it's strength and eventually a very accurate market forecast.
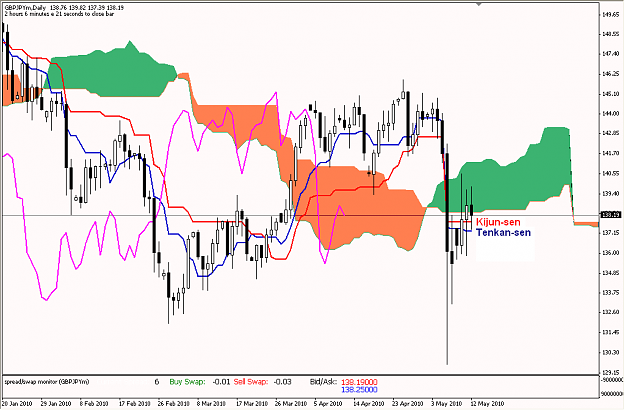
Momentum:
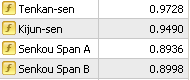
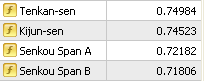
Is dictated by two instruments: Tenkan and Kijun-sen-sen. Their position, one above the other, we can determine with precision movement "present" the market. So Kijun-sen with a less value than Tenkan-sen is telling us momentum down, as shown:
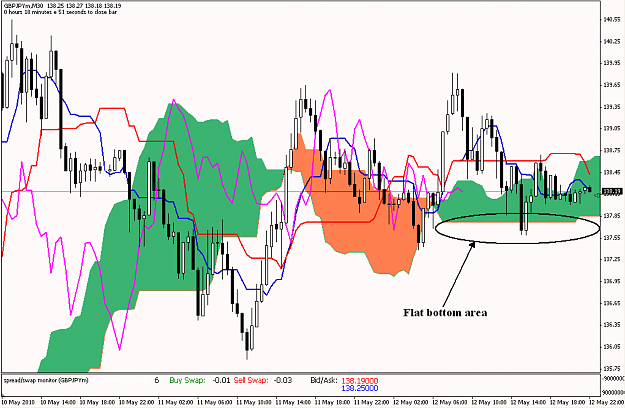
Market's sentiment:
Kumo is dictated by two instruments: Senkou Span A and Span B Senkou position, one above the other can give us valuable information about the general tone of the market, the possible vulnerabilities in a trend or correction or of sudden change in trend. It become bearish when Senkou Span A crosses bellow the Senkou Span B, as you observe that is a high probability changing in trend's direction, although nothing is announcing that the possible decline.
Kumo's may report and delimitation of the range, flat tops or flat bottoms (a highly resistances and support zones), almost horizontal lines drawn by Spain's Senkou or Senkou Span B.
The general trend:
By definition, the general trend is dictated by the position of the bar price / lamp current with respect to Kumo. A positioning of the price above the Kumo
it shows an up general trend. General trend is given and the position Chikou's Span (colored in violet), as the delay is the way it is designed so you can better determine the break-out sites in the crucial moment when it is closed under/over Kumo.
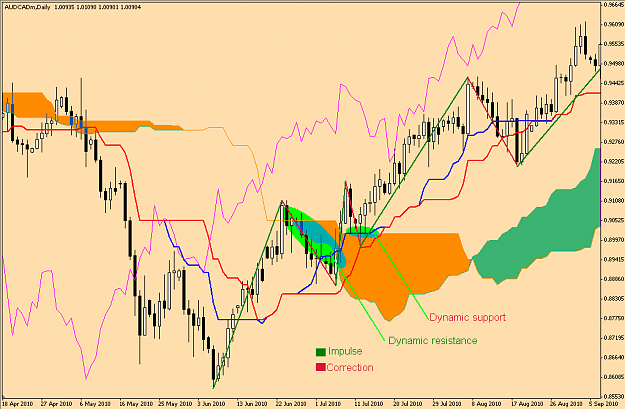
Trend's power (or its severity):
Kumo's thickness gives us, most of the times, valuable clues about the current movement, if we are in a correction or, on the contrary, in a impulse. If it is in equilibrium or balance.
On impulsive moves have a very narrow band and on the correct ones is narrow or even flat.
Dynamic supports and resistances:
Ichimoku has the advantage of showing the possible future dynamic support and resistance, which can be used both as targets and stop-loss as mobile and so. Here's how both Tenkai-sen-sen Kijun and Senkou Span A and Span B Senkou played a role in shaping future decisive support / resistance.
Trend forecast:
Kumo, which is projected in the future, give us clues about which direction the price is likely to develop. Here, below, progressively, as did the price:
Eighty years ago, Hosoda Goichi, a Japanese journalist, begins to develop a technique for analyzing the market and, after about thirty-eight years of training, in 1968 reveals a system that translated literally means: "one glance equilibrium chart", which the Western world would be known only in the 90s.
What makes it unique in the world of abundant in oscillators, is that his performance shows a more accurate vision of what is happening on chart, so setups that have high probability of development, on short, medium and long term, is clearly distinguishable from those with a very small probability.
Structure
Based on pure price-action , Ichimoku is calculated in a similar fashion with Moving Average, represents a more advanced graphics by the five studies) with it contains and which I will take turns and I will present as follows (Default configuration: 9, 26, 52) :
Tenkan-sen and the turning line
Is computed using the formula: (the highest peak (high) + The lower base (bottom) )/ 2 - for the last nine periods.
Kijun-sen or standard line
Is computed using the formula: (The highest peak (high) + The lower base (bottom)) / 2 - for the last 26 periods.
Chikou Span or the lagging line
Is calculated as: current closing price projected back in the past 26 periods
Senkou Span A or first leading line
It is calculated by the formula: (Tenkan-sen + Kijun-sen)/2 projected on 26 periods in the future.
Senkou Span B or the second leading line
It is calculated by the formula: (The highest peak (high) + The lower the (Bottom)) / 2 - for the last 52 times, projected 26 periods in the future.
The notion of Kumo (cloud) is represented by two indicators Senkou Senkou Span A and Span B, united in a "band" with a fill effect, while other indicators: Tenkan-sen-sen and Chikou Kijun Spain are represented by individual separated lines.
Attached Image (click to enlarge)
Features
As a tool for more exotic analyses, it could show your current momentum, the general trend, speed of trend, dynamic supports and resistances, it's strength and eventually a very accurate market forecast.
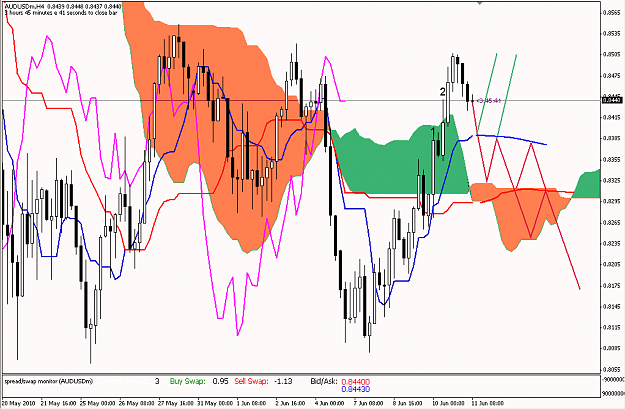
Momentum:
Is dictated by two instruments: Tenkan and Kijun-sen-sen. Their position, one above the other, we can determine with precision movement "present" the market. So Kijun-sen with a less value than Tenkan-sen is telling us momentum down, as shown:
Attached Image (click to enlarge)
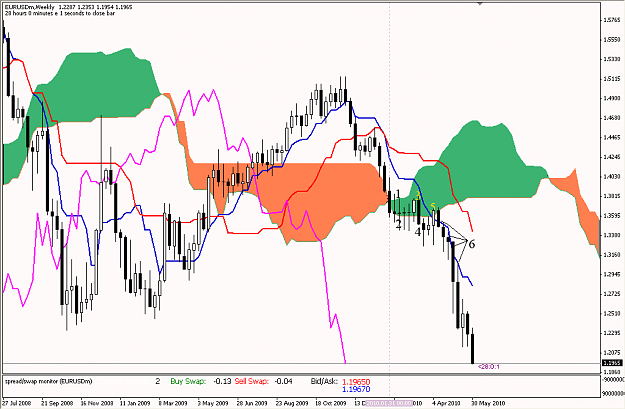
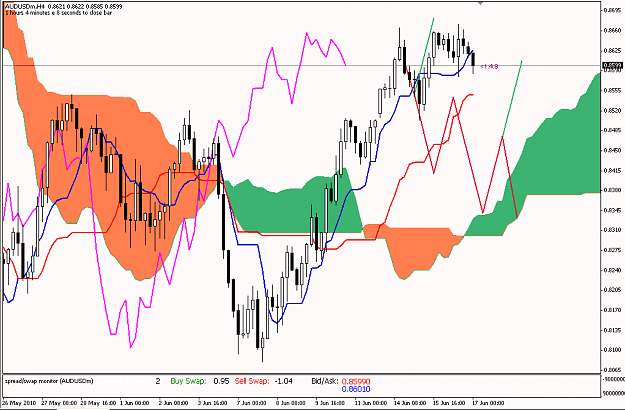
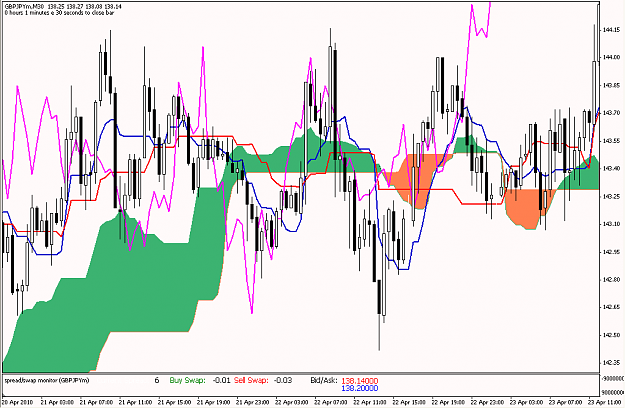
Market's sentiment:
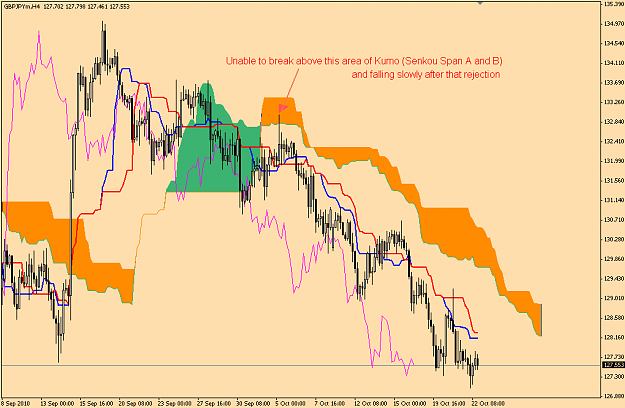
Kumo is dictated by two instruments: Senkou Span A and Span B Senkou position, one above the other can give us valuable information about the general tone of the market, the possible vulnerabilities in a trend or correction or of sudden change in trend. It become bearish when Senkou Span A crosses bellow the Senkou Span B, as you observe that is a high probability changing in trend's direction, although nothing is announcing that the possible decline.
Kumo's may report and delimitation of the range, flat tops or flat bottoms (a highly resistances and support zones), almost horizontal lines drawn by Spain's Senkou or Senkou Span B.
Attached Image (click to enlarge)
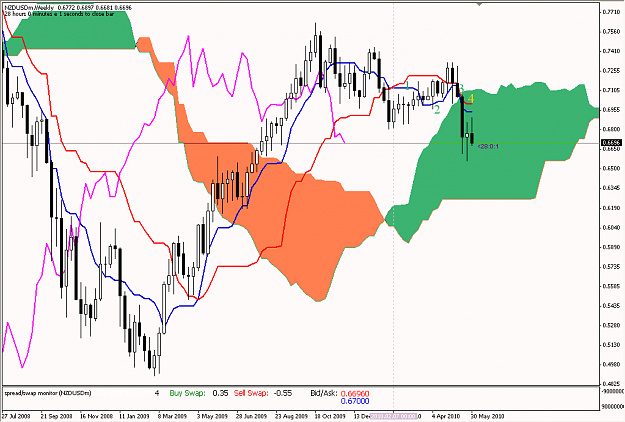
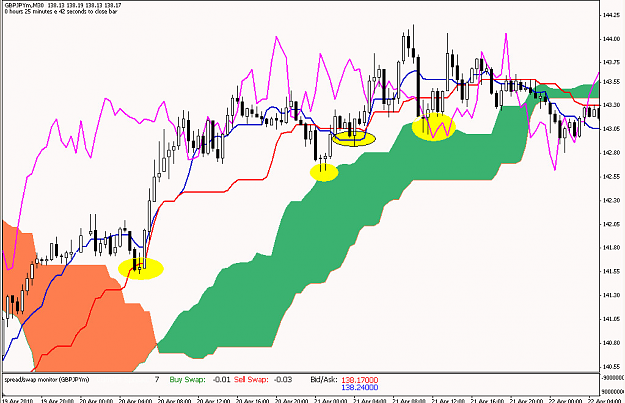
The general trend:
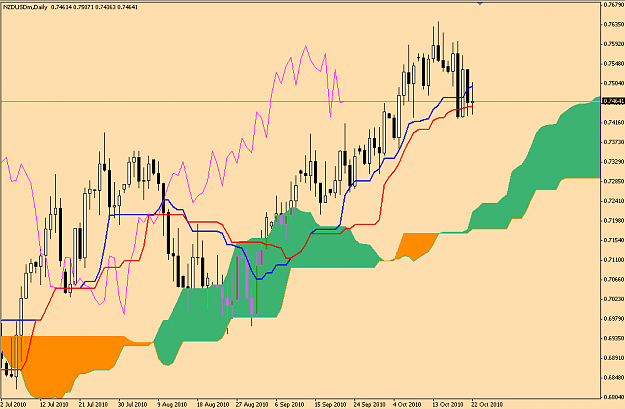
By definition, the general trend is dictated by the position of the bar price / lamp current with respect to Kumo. A positioning of the price above the Kumo
it shows an up general trend. General trend is given and the position Chikou's Span (colored in violet), as the delay is the way it is designed so you can better determine the break-out sites in the crucial moment when it is closed under/over Kumo.
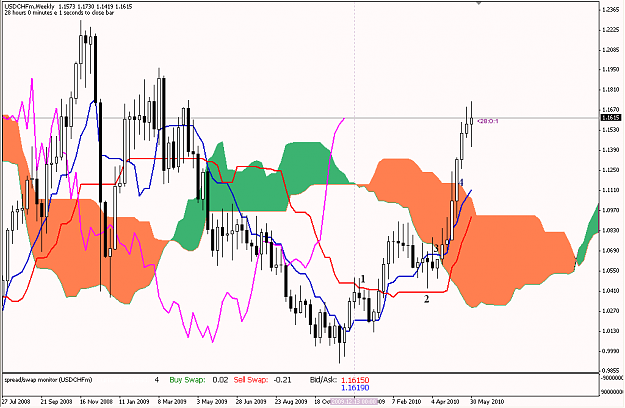
Trend's power (or its severity):
Kumo's thickness gives us, most of the times, valuable clues about the current movement, if we are in a correction or, on the contrary, in a impulse. If it is in equilibrium or balance.
On impulsive moves have a very narrow band and on the correct ones is narrow or even flat.
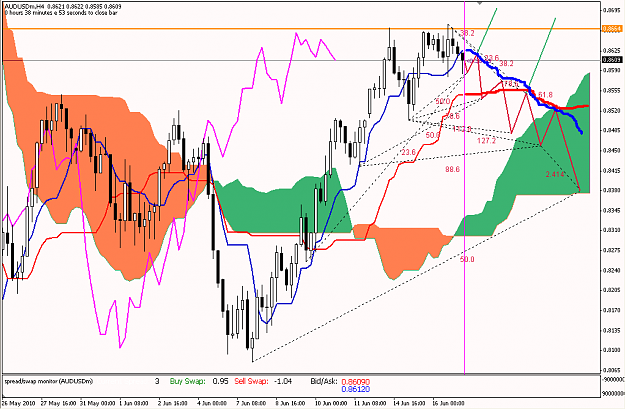
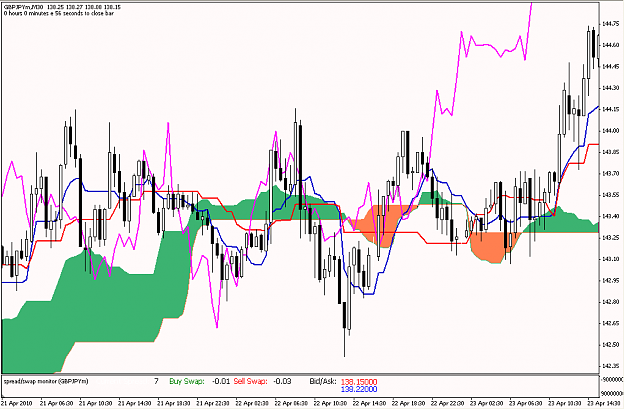
Dynamic supports and resistances:
Ichimoku has the advantage of showing the possible future dynamic support and resistance, which can be used both as targets and stop-loss as mobile and so. Here's how both Tenkai-sen-sen Kijun and Senkou Span A and Span B Senkou played a role in shaping future decisive support / resistance.
Attached Image (click to enlarge)
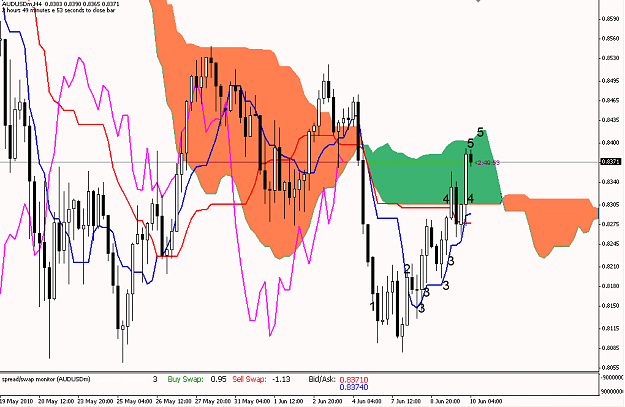
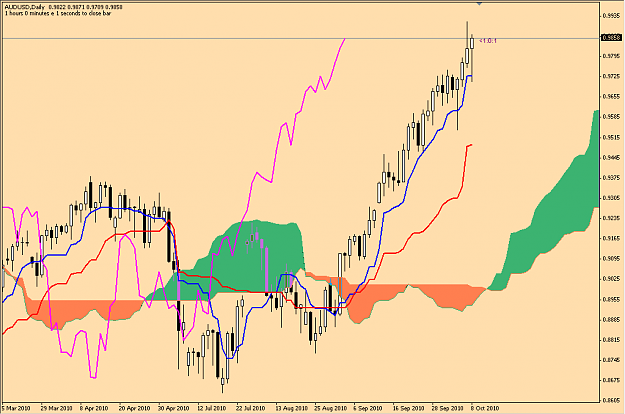
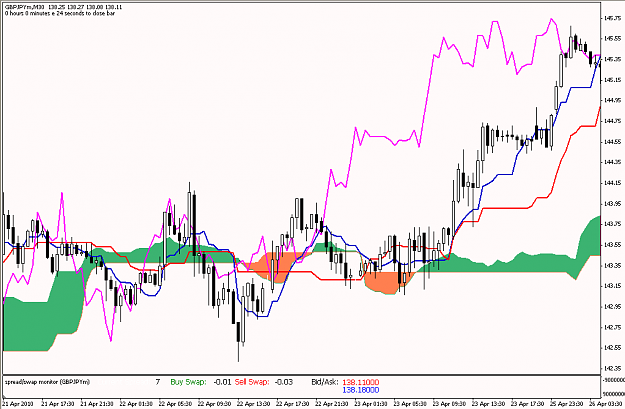
Trend forecast:
Kumo, which is projected in the future, give us clues about which direction the price is likely to develop. Here, below, progressively, as did the price:
Attached Image (click to enlarge)
Attached Image (click to enlarge)
Attached Image (click to enlarge)