The Question to be made is: "What does a Trader need, to be Successful?". It looks like a complex Question, right from the start. Your thoughts fly away to Trading Plans, Strategies, Systems, Methods, but You have to keep into attention the >>> Timing Factor <<<.
The Entry and the Exit (Stop Loss or Take Profit) of the Trade, are the Components that make it Succesful or not.
Of course that you need a complete Analysis, both Fundamental, and Technical to get the Best Entry and Exit for the trade. You might have a great analysis, very accurate, very precise, regarding the Direction of the Market Price, but if you enter too early You might trigger our Stop Loss before the Trade goes the way You have Predicted. On the other hand if You enter too Late, you might lose the Market Move and wake up in the Middle of a high risk trade.
The >>>TIMING<<< issue involves a Time Factor - the best Moment to Enter/Exit the Market.
How can You find the Best Moment in a Time Based Chart?... You have to take "another View of the Market", one that is beyond the Time Factor.
So, We have a Timing Problem, and the Best Solution can be found by Detaching Yourself from the Time Factor.
The next step to take is to concentrate on the >>>Price Movement<<<, on the Volatility of the Market, beyond the Time by using the Range Bars/Candles Charts.
>> It is amazing how You can use Trading Instruments from the time Based charts, in the Constant Range Bars/Candles Charts analysis, and combine them with specific Tools from the Price Movement Charts (R.B.C. - Range Bars Charts).
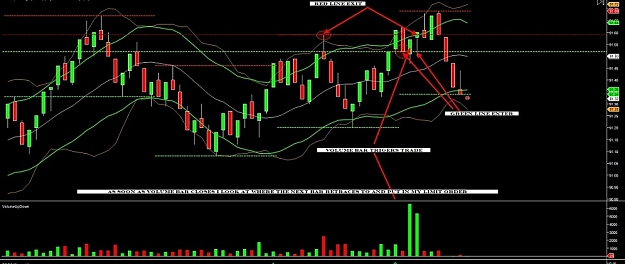
>> For example, You can use Pivots (Daily, Weekly and Monthly - Time Based) combined with Moving Averages from the Range Bars Charts, other than those from the related Time Based Charts, and also Trendlines and Channels based only on Price Movement.
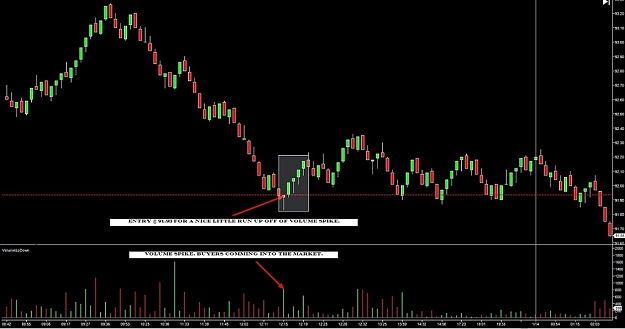
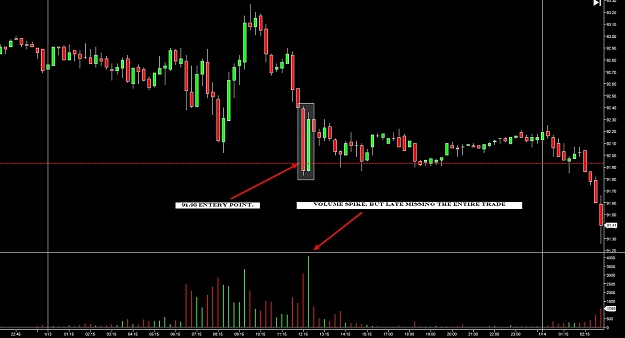
>> However, the real Help comes from the Volumes indicator, and the Volume Spread Analysis conducted in the range Bars Charts, because We have a different number of Bars/Candles, and the Volume is distributed different from the time Based Charts.
>> Another Important Difference, the Bars/Candle Formations, show Different Signals, sometimes earlier then the Time Based Chart, correlated with Volume and the Technical and Fundamental Analysis in both types of Charts.
>> >>>IMPORTANT<<< Volume doesn't Always follow the Fundamental Anaysis and News. They are sometimes higher during the OPEN/CLOSE of the Asian (Tokyo), London or New York.
>>>SOLUTION - Use the Time Factors, Fundamentals and Market Opening and Closing to Spot the Best Entry and Exit Signals by using the Constant Range Bars Charts (Price Movement and Volatility Charts), with the Specific Tools: Volumes, Volume Spread Analysis, combines with Candle/Bars Formations and Technical Analysis. Just Follow the "Smart Money" (Professional Traders) Real Movement.
To Your Success,
Doctortyby - Tiberiu
The Entry and the Exit (Stop Loss or Take Profit) of the Trade, are the Components that make it Succesful or not.
Of course that you need a complete Analysis, both Fundamental, and Technical to get the Best Entry and Exit for the trade. You might have a great analysis, very accurate, very precise, regarding the Direction of the Market Price, but if you enter too early You might trigger our Stop Loss before the Trade goes the way You have Predicted. On the other hand if You enter too Late, you might lose the Market Move and wake up in the Middle of a high risk trade.
The >>>TIMING<<< issue involves a Time Factor - the best Moment to Enter/Exit the Market.
How can You find the Best Moment in a Time Based Chart?... You have to take "another View of the Market", one that is beyond the Time Factor.
So, We have a Timing Problem, and the Best Solution can be found by Detaching Yourself from the Time Factor.
The next step to take is to concentrate on the >>>Price Movement<<<, on the Volatility of the Market, beyond the Time by using the Range Bars/Candles Charts.
>> It is amazing how You can use Trading Instruments from the time Based charts, in the Constant Range Bars/Candles Charts analysis, and combine them with specific Tools from the Price Movement Charts (R.B.C. - Range Bars Charts).
>> For example, You can use Pivots (Daily, Weekly and Monthly - Time Based) combined with Moving Averages from the Range Bars Charts, other than those from the related Time Based Charts, and also Trendlines and Channels based only on Price Movement.
>> However, the real Help comes from the Volumes indicator, and the Volume Spread Analysis conducted in the range Bars Charts, because We have a different number of Bars/Candles, and the Volume is distributed different from the time Based Charts.
>> Another Important Difference, the Bars/Candle Formations, show Different Signals, sometimes earlier then the Time Based Chart, correlated with Volume and the Technical and Fundamental Analysis in both types of Charts.
>> >>>IMPORTANT<<< Volume doesn't Always follow the Fundamental Anaysis and News. They are sometimes higher during the OPEN/CLOSE of the Asian (Tokyo), London or New York.
>>>SOLUTION - Use the Time Factors, Fundamentals and Market Opening and Closing to Spot the Best Entry and Exit Signals by using the Constant Range Bars Charts (Price Movement and Volatility Charts), with the Specific Tools: Volumes, Volume Spread Analysis, combines with Candle/Bars Formations and Technical Analysis. Just Follow the "Smart Money" (Professional Traders) Real Movement.
To Your Success,
Doctortyby - Tiberiu
Attached Image