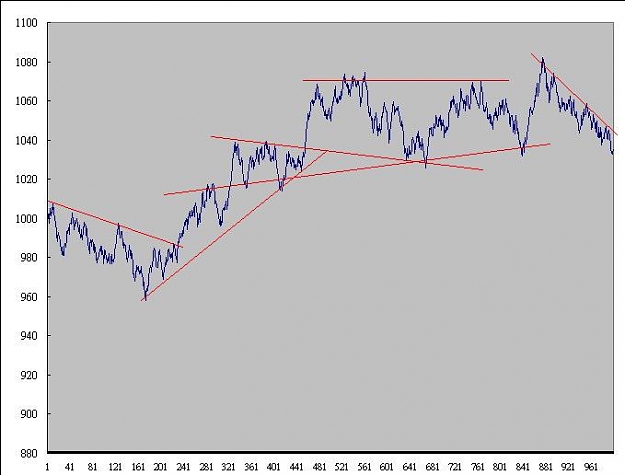
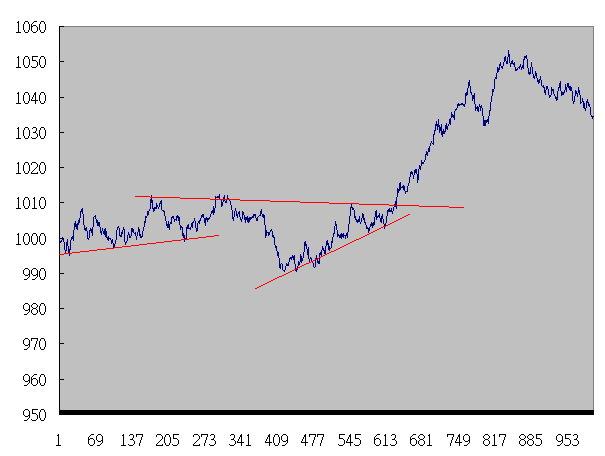
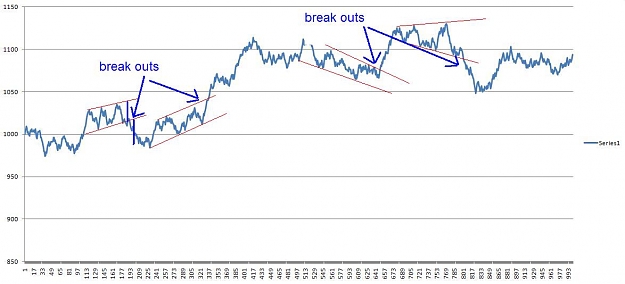
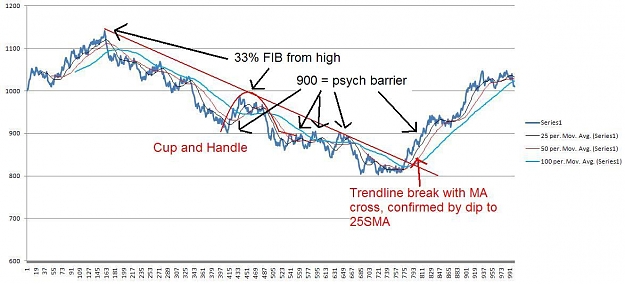
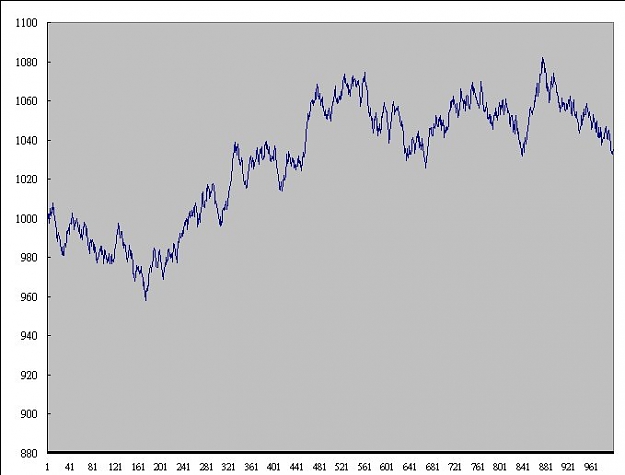
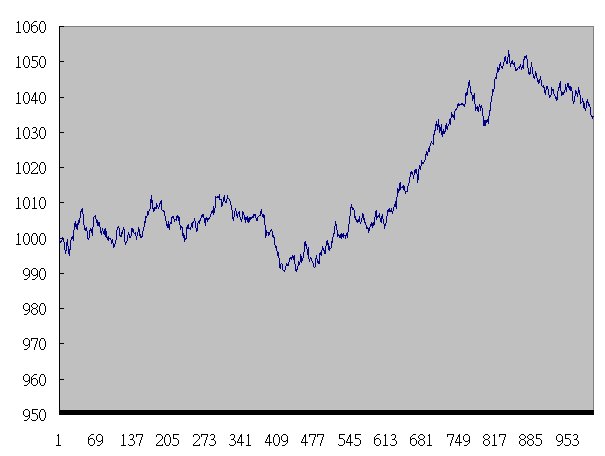
I have tried to generate random price movement and plot on a chart. Originally, my intention was to prove that price is not moving random but in a "cluster" like fashion with S/R and TL in action. However, what I discover seem to contradict to this idea. Here are the charts generated in two slightly different methods. On each of them, it seems to me there are clear support/resistance and Trendline. Why is that???? Is it a scientific discovery???
I have also attached the excel file with the formula on.
Any Ideas?
I have also attached the excel file with the formula on.
Any Ideas?
Attached Image (click to enlarge)
Attached Image
Attached File(s)