thanks - i just realised that i can use the search funktion but can you please let me know what to download exactly - i have downloaded the cave manager v.1.41 but my picture didn´t look the same - where are the indicators that i will have to put on the chart??? thanks for your help
thanks - i just realised that i can use the search funktion but can you please let me know what to download exactly - i have downloaded the cave manager v.1.41 but my picture didn´t look the same - where are the indicators that i will have to put on the chart??? thanks for your help
Ignored
I don't think he is telling you about any indicators - here is the exact post of CAVEMAN, please read the manual, I don't think you know for sure what an EA is ???
Actually maybe of interest to other here as they mention use of ATR for stops & take profit!
I am alive and well. Here's the latest THV CaveManager 1.41 with these new features.
--------------------------------------------------------
Added auto setting of SL using ATR x factor.
Added auto setting of TP using ATR x factor.
Added Trailing stop by ATR using ATR x factor.
Updated code to work with TzPivot v3.2 released in Jan 2010.
Added support for trailing price using high (sell) and low (buy) of previous candle plus spread.
Revamped status display by using labels instead of comment.
--------------------------------------------------------
Please read the instruction manual before using any of these new features.
Just go to your TDI settings then go to colours and change 1 and 3 to blue thats it, its the standard settings. I didnt change anything except the colours.
Well i aint a big fan of 1H but you can test it out and see if it works,
it works like a charm on 4H
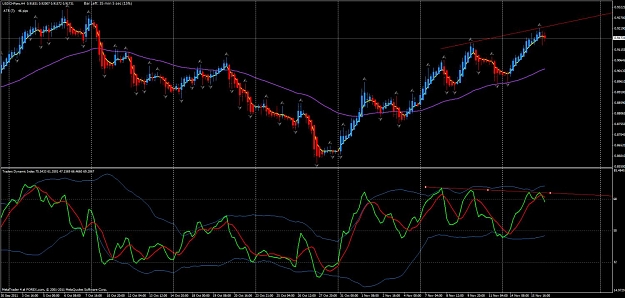
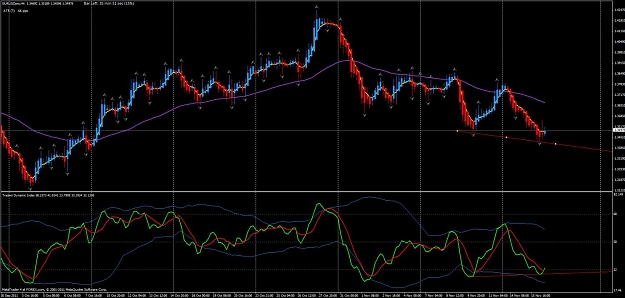
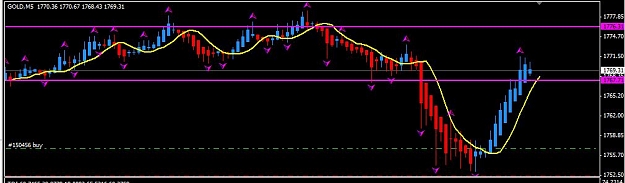
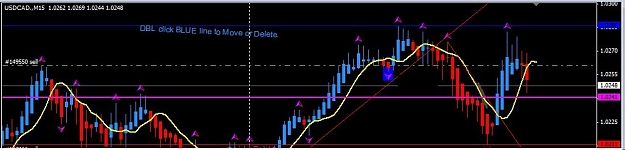
For some guys thats wondering to which crosses should they trade , I'm posting a chart that would help increase your win rate and make more pips.
This is a conservative style and it would allow you to catch a trend early. so we are basically looking for the TDI to touch or pierce the Blue bands then...
Ignored
Thank you X-Man - I was trading every cross that fell within the parameters of the TMS indicators but with so-so success. Your post will be a big help. You have ditched stochs, correct?
One question - what are the settings for the purple ema?
..............I've marked the charts with arrows, the double arrows show that those trades will have a much higher success because its touching the Purple EMA and on TDI is touching the blue bands so at that point you can almost predict where PA is going to go........
Ignored
Thanks what's your EMA setting?
"It always seems impossible until it is done" Nelson Mandela
Thank you X-Man - I was trading every cross that fell within the parameters of the TMS indicators but with so-so success. Your post will be a big help. You have ditched stochs, correct?
One question - what are the settings for the purple ema?
|
Commercial Member
|
Joined Aug 2011
|2,409 Posts
The purple EMA is 60 shift 0 typical.
The yellow EMA is 4 shift 0 typical.
I only use the indicators on my chart nothing else.
I dont use stoc as this messes with my decisions.
The EMA act as a support and resistance. It could be adjusted to your liking.
I agree....choppy markets are hard to trade. The red squares on my chart show how the market is moving sideways from about the time London closes until late in the Asian session. The good news is that the London session is still showing fairly good movement on the EU....the 5 day ADR is 216....yesterday's daily range was down to 144 and today the daily range was about 122.....however, almost all of that movement occurred during the London session. There is still enough PA to make...
Ignored
Hi Phx62
Still trying to emulate your style.
How do you monitor a trade. Is it every hour and dont do anything inbetween or constantly which means you dont go back to bed.
Im amazed also how you can xit a loosing trade for say - 11 pips if you only look at the H4 chart. Is it just knowledge and/or intuition
The purple EMA is 60 shift 0 typical.
The yellow EMA is 4 shift 0 typical.
I only use the indicators on my chart nothing else.
I dont use stoc as this messes with my decisions.
The EMA act as a support and resistance. It could be adjusted to your liking.
The purple EMA is 60 shift 0 typical.
The yellow EMA is 4 shift 0 typical.
I only use the indicators on my chart nothing else.
I dont use stoc as this messes with my decisions.
The EMA act as a support and resistance. It could be adjusted to your liking.
Ignored
Thanks using only 4h myself taken a while to get STM right, now just refining to my style.
Looks good
"It always seems impossible until it is done" Nelson Mandela
How do you monitor a trade. Is it every hour and dont do anything inbetween or constantly which means you dont go back to bed.
Im amazed also how you can xit a loosing trade for say - 11 pips if you only look at the H4 chart. Is it just knowledge and/or intuition
regards
miki
Ignored
Hi miki,
I have found the best way to get the pips out of a trade is to get a good setup at a time when there is volume (London Open usually gives good PA), set an emergency SL (50 pips) and a TP of 50 pips and let it run (your a lot less tempted to mess with it every time there is small pullback). I will then monitor the trade until it moves 10 or 20 pips in my direction and then walk away from the computer. If PA pulls back during that first 10 or 20 pips, I know my analysis was not right, so I try to exit with a small profit or small loss, then look for another setup.
When I do monitor a trade (that often depends on how much sleep I've had), I check it once or twice an hour and if the PA is good, I will sometimes move my TP to 100 or 200 and trail 5 pips behind the previous candle. When I change the TP, I then monitor is almost constantly and will usually exit if it pulls back 20 or 25 pips.
I only trade the EU H1 chart during London. Haven't really spent the time and study to be comfortable with the H4 charts yet.