Ah, what a week! Celebrated last night with Champagne, wie üblich. This morning Oolong tea in a beautiful glass teapot, that I recently ordered from Japan, Erik Satie on the soundsystem, and time to take a look at the longer view.
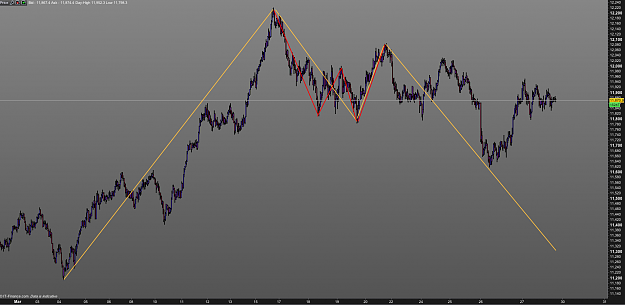
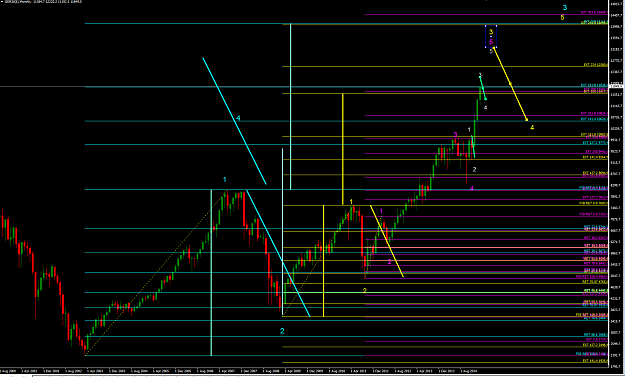
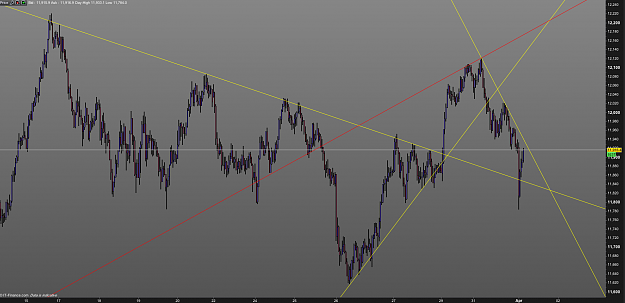
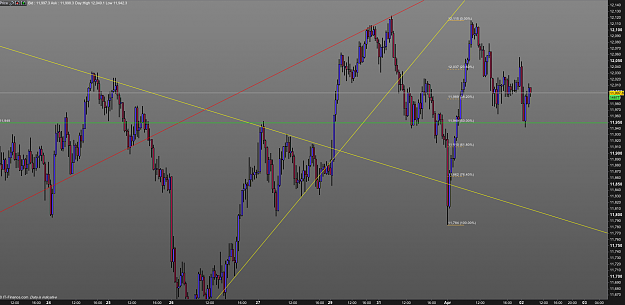
From the point of view of harmonic patterns, which DAX exhitits a lot of, the top formation highlighted in my post last weekend was the confirmation of bearish harmonic pattern (red), and the beginning of the last leg of a bat pattern (yellow) with bottom at, at least, 11300.
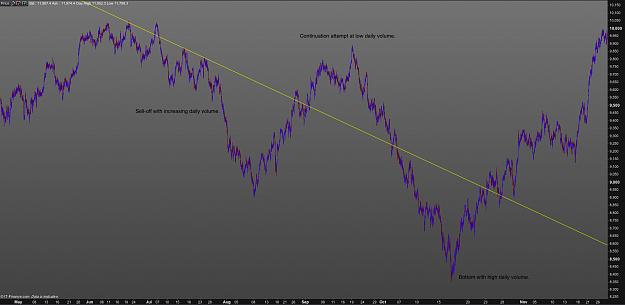
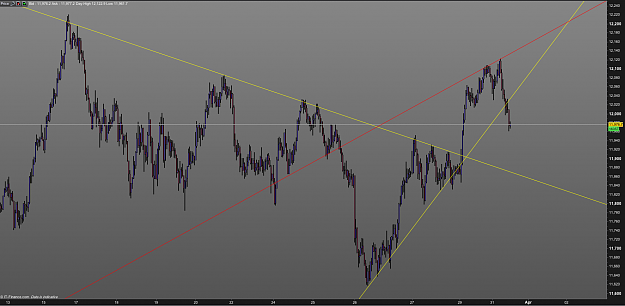
From the point of view of volume analysis, we can compare with the correction from the 10000 level. Then there was, first, a sell-off with increasing daily volume, a continuation attempt at low daily volume, and finally the bottom of the correction with unusually high daily volume. (These are tick charts, so "longer" days on the time scale means higher daily volume.)
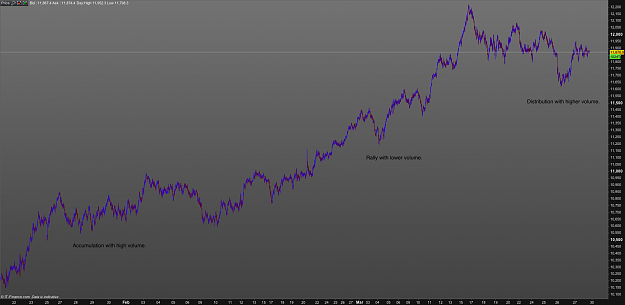
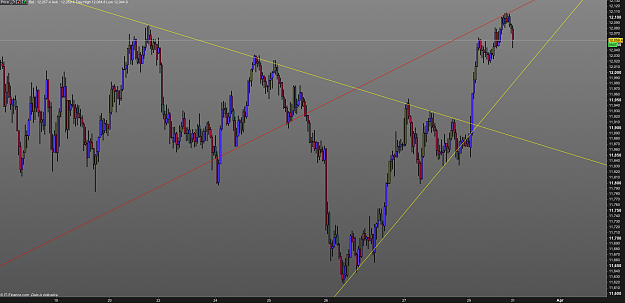
Looking at the rally since the ECB announcement, there was first accumulation under high volume without moving the market much, then the sparkling rally with low daily volume, and now, at the end of this week, just like back in the summer, a sell-off with increasing volume.
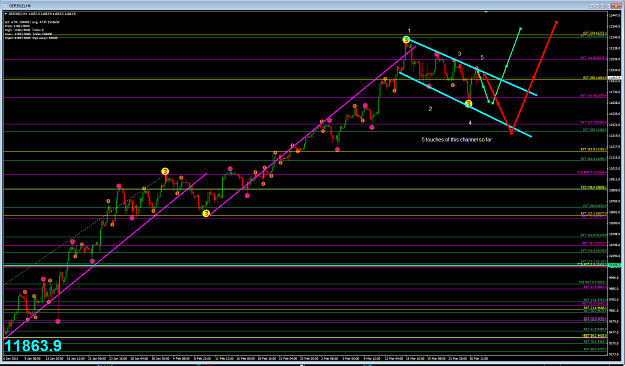
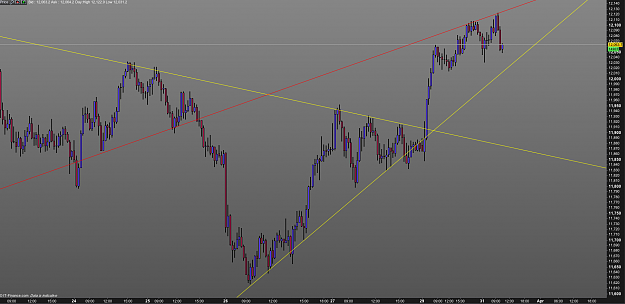
Putting it all together, this gives us two scenarios for the next few days. Either the declining trend line (see my last post) will hold, and end of month will result in a sell-off, or there will be a continuation attempt from end of month buyers under, likely, low volume, before the correction completes itself. The latter scenario would be in line with 2be's EW analysis.
In either case, the coming week should be bountiful.
11300 (at least), here we come!
From the point of view of harmonic patterns, which DAX exhitits a lot of, the top formation highlighted in my post last weekend was the confirmation of bearish harmonic pattern (red), and the beginning of the last leg of a bat pattern (yellow) with bottom at, at least, 11300.
From the point of view of volume analysis, we can compare with the correction from the 10000 level. Then there was, first, a sell-off with increasing daily volume, a continuation attempt at low daily volume, and finally the bottom of the correction with unusually high daily volume. (These are tick charts, so "longer" days on the time scale means higher daily volume.)
Looking at the rally since the ECB announcement, there was first accumulation under high volume without moving the market much, then the sparkling rally with low daily volume, and now, at the end of this week, just like back in the summer, a sell-off with increasing volume.
Putting it all together, this gives us two scenarios for the next few days. Either the declining trend line (see my last post) will hold, and end of month will result in a sell-off, or there will be a continuation attempt from end of month buyers under, likely, low volume, before the correction completes itself. The latter scenario would be in line with 2be's EW analysis.
In either case, the coming week should be bountiful.
11300 (at least), here we come!
Attached Image(s) (click to enlarge)