Joined Jan 2008
|
Status: Lunatic Supreme
|1,840 Posts
Have you found any adherence to weekly, monthly or yearly pivots? Daily pivots often become intra-day resistance/support, but I've never seen that effect on other time frames.
If so, do any of the midpoints seem to matter? They're very useful during the day, but on a weekly TF... haven't seen much of that either.
Edit: Just looked at the indi, you're using fibs for pivots?
Joined Jan 2008
|
Status: Lunatic Supreme
|1,840 Posts
Guess you're using the wrong formula . I have great results w/ daily pivot points on intra-day charts using the standard (H+L+C)/3 formula, with the daily bar start set to midnite GMT. The pivot itself isn't as useful as the R1/S1 and R2/S2 lines, along w/ their midpts, are. What pair are you trying them on?
Anyway, didn't want the thread to die on a nasty note. Ditching the sunday bar from the weekly candle is a good idea.
Ignored
Have you done any testing to show the accuracy of pivots? If so, could you post it? Why would you skip market data? Sunday night to you is Monday mornig to someone else. Their trading activity doesn't count to everyone who can read a chart? How can the R and S lines be more accurate than the pivot istelf since they are simply derrivitives of the original formula?
Pivots draw 7 lines on a chart (more if you use multiple time frames). How could price not temporarily touch 1 or more lines?
To make pivots work they would have to be "self fullfilling" but since you guys can't agree on a formula or even when midnight occurs I seriously doubt they have any effect on the market.
Sorry if I hurt your feelings. I would rather that happen than have others actually believe that pivots had some meaning.
Joined Jan 2008
|
Status: Lunatic Supreme
|1,840 Posts
Quote
Disliked
Have you done any testing to show the accuracy of pivots? If so, could you post it? Why would you skip market data? Sunday night to you is Monday mornig to someone else. Their trading activity doesn't count to everyone who can read a chart? How can the R and S lines be more accurate than the pivot itself since they are simply derrivitives of the original formula?
I've done a lot of testing. Today's news release is a good example, the EURUSD found resistance at the R2/R3 midpt, the GBPUSD did the same, then fell back to R2.
I use midnight GMT, which is 8pm to me. GMT is a standardized timezone, that's all.
Quote
Disliked
Pivots draw 7 lines on a chart (more if you use multiple time frames). How could price not temporarily touch 1 or more lines?
It has nothing to do with "temporarily" ... When price hits R2 or S2 it often runs out of steam for the day, especially if it does this after 11am eastern timezone. I'm not given to random fits of loyalty, these things have proven themselves over and over again. All I can say is check for yourself. Zoom out to the hourly, plot the current trend line, and find the R/S that's closest to it. Watch how price behaves around that line.
Quote
Disliked
To make pivots work they would have to be "self fullfilling" but since you guys can't agree on a formula or even when midnight occurs I seriously doubt they have any effect on the market.
Uhm, most ppl use the (H+L+C)/3 base, and the subsequent formulas. They work, that's all I can say. You don't have to use them, laff, nobody is forcing you to. I'm just saying for intra-day trading they're remarkably accurate areas of resistance and support. Do what you want, I can only lead a person to water... I can't force them to drink... nor would I.
Quote
Disliked
Sorry if I hurt your feelings. I would rather that happen than have others actually believe that pivots had some meaning.
Laff, sounds like you're on a bit of a holy quest. Had some bad results you're not sharing?
Joined May 2005
|
Status: I am not your bro
|1,302 Posts
You're using midpoints as well? Isn't that nice. Instead of 7 lines, you have 11 lines on your chart. Yeah price is going to hit one of them. I would love to see your EURUSD chart for today.
The market dries up every day around 1100 ET. Don't kid yourself and think that one of your 11 lines has anything to do with that.
I still didn't catch those pivot test results. I don't have the luxury of trading something by gut feel. I'm sure that you're a nice guy and a brilliant trader but I suspect you, or any other pivot trader, do not posess, nor have you seen, any concrete data showing that pivots work.
Floor trader pivots once had a purpose in futures markets where there were floors and traders and a distinct beginning and end to the trading day. Forex has none of those characterisitics. Pivots are nothing more than a security blanket to give you the courage to enter/exit a trade where you otherwise couldn't make a decisoin for yourself.
Joined Jan 2008
|
Status: Lunatic Supreme
|1,840 Posts
Quote
Disliked
You're using midpoints as well? Isn't that nice. Instead of 7 lines, you have 11 lines on your chart. Yeah price is going to hit one of them. I would love to see your EURUSD chart for today.
I actually have quite a few more lines than that. I like lines. But I use them all differently, some are just to help me see trends, some are to help me see ranges, some don't have any meaning except to me. Some, on the other hand, have meaning over and over.
I feel a bit like I've hijacked this thread, laff. But to clarify what I see... here are a few charts.
Chart 1 is the cable, hourly. Everything is pretty self-explanatory. Price traded in a tight range between the Piv/S1 and previous high. If the range was tighter I would've taken this trade as an ORB around 1.9855 but I didn't because the range was too loose.
Anyway, when the GDP and the unemployment numbers broke they were worse than expected (not surprising tho), and price broke out. You can see where that hour ended, right at the R1/R2 midpt. The next hour carried it right to R2/R3 midpt, where it began to fade. Notice that the R2/R3 midpt matches nicely with the trendline and the 365 SMA too. Confluence like that happens wayyy too often.
It faded back to R2 for about 15 minutes, then went back to R1/R2 midpt. As you can see from the candle time indi the hourly bar had 2 minutes left, it ended perfectly at the R1/R2 midpt. If I had to speculate on it's eventual decline I'd say it'd probably head back to yesterday's high, maybe fall back into a range around the axis. I don't know really there tho, and don't care to know, as that's not how I trade.
Lest you think that's a one-time occurrence, the EURUSD is chart 2. You can see from the candle time that it was taken about 40 seconds after chart 1. Price traded rather tightly until 2am, broke out from it's range and settled in around R1-Piv/R2. Broke out as the data came out, went straight up, reversed around the R2/R3. Price was sitting right at 1.5645 when I took the chart. It finally broke thru, but just as you'd expect a light resistance turned into a light support on the way down. Again notice trendline confluence at R2, taking price action into account there it would've been impossible for price to continue going much further. There just aren't any supporting trades on that side of the trendline, which is a pretty useful bit of info.
It's hard to fail to notice the pinbar that's forming on the cable. It's a great setup, probably for tomorrow. We could see a trend day there tomorrow.
Anyway... all of this is intra-day. I've not seen similar on weekly and monthly, but maybe someone else has. If so, by all means...
Quote
Disliked
The market dries up every day around 1100 ET. Don't kid yourself and think that one of your 11 lines has anything to do with that.
Joined Jan 2008
|
Status: Lunatic Supreme
|1,840 Posts
Quote
Disliked
What did you answer? Price went up today and then it went down. It didn't come close to touching any of your pivot lines.
Touched the 23.6 and retreated off of it. That's quite nice, what that means is there's a ratio between the pivot formula I use and the one you're using. I wonder how often that happens...
Ed: I just have to laugh a bit...
Quote
Disliked
It faded back to R2 for about 15 minutes, then went back to R1/R2 midpt. As you can see from the candle time indi the hourly bar had 2 minutes left, it ended perfectly at the R1/R2 midpt. If I had to speculate on it's eventual decline I'd say it'd probably head back to yesterday's high, maybe fall back into a range around the axis. I don't know really there tho, and don't care to know, as that's not how I trade.
That was a few hours ago. I was talking about the cable on the hourly. Anyone care to take a guess at what happened? Hehe, dropped right back down, past the high and fell into a range around the axis. Spot-on. Anyone that says you can't predict intra-day movements is full of crud.
Dang I need to finish that price density indicator...
Joined Jan 2008
|
Status: Lunatic Supreme
|1,840 Posts
One of his. It's the pivot plus 23.6% of the previous day's range (high minus low). Has me thinking tho, since I haven't found standard pivs to work well on weekly or monthly TF, maybe fibs would. I don't usually fib time frames, just swings... but I'll keep an eye out.
That was a few hours ago. I was talking about the cable on the hourly. Anyone care to take a guess at what happened? Hehe, dropped right back down, past the high and fell into a range around the axis. Spot-on. Anyone that says you can't predict intra-day movements is full of crud.
Ignored
Anyone can can guess at what already happened. If you can really predict price movement beyond knowing that price will stop, go past, or bounce off of one of many lines, then you have a rare talent.
Joined Jan 2008
|
Status: Lunatic Supreme
|1,840 Posts
Quote
Disliked
Anyone can can guess at what already happened. If you can really predict price movement beyond knowing that price will stop, go past, or bounce off of one of many lines, then you have a rare talent.
You'll notice I posted that 2 hours in advance of it happening
Altho in all seriousness it was just a lucky guess, and phrased ambiguously enough to not matter. I'm quite sure my hit/miss rate on those kind of guesses would be no better than 50% over time, but that's why I don't trade that way either... =)
Still, it's fun to dream occasionally. Rabid the Great predicts the Euro will either go up... or go down. But it will certainly do one of those things, unless it doesn't, then it won't. Ta-da! It's magic...
Joined Nov 2007
|
Status: Trying manual mode again
|2,210 Posts
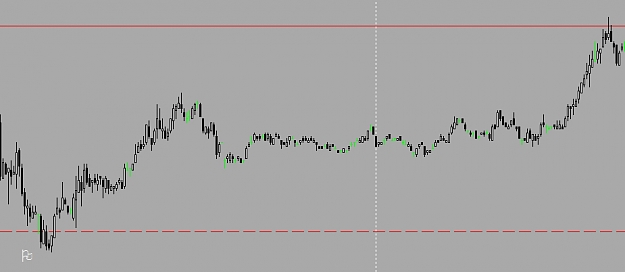
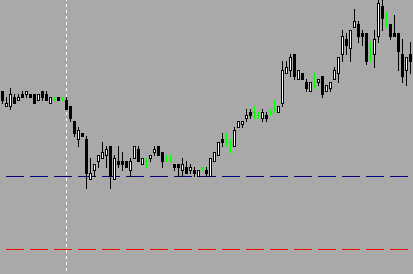
Here are some examples of yearly and monthly pivots in action on the eurusd. These charts are from a 5 min chart and clearly show support and resistance around monthly and yearly pivots.
The larger image is from the eurusd yesterday into today. Price came down to the monthly m2 held then reversed and went to the monthly central pivot. This is one of my favorite trades. I use a relatively slow stochastic and I look for situations where price is holding near a pivot AND the stochastis is either overbought or oversold. Wait for a trendline break and then enter. Profit target is the next pivot. Works best on the 1 hr timeframe.
Second smaller image is from last week also eurusd. Price came down to the yearly pivot held for a while and then reversed.
I do not use weekly or daily pivots only monthly and yearly. Will price continue through?? It can and does. But as you can see it offers some reliable support and resistance levels.
I think pivot points are total crap. Even your own chart shows no respect for the guesses that pivots offer.
In a market that trades 24/7 how can you define a "new day?" There are at least 4 different formulas for pivots. Which one did you use?
I would take trading advice from the tooth fairy before I put money on a pivot.
Ignored
I think its you that don't make any sense!!! what do you think traders used before all this electronic trading began, and they made money doing it!!! Do you reasearch before you jump to stupid conclusions!!!
Joined Jan 2008
|
Status: Lunatic Supreme
|1,840 Posts
Quote
Disliked
Guys as I explained earlier the secobd chart i posted uses the standard weekly pivots that i use for day trading.
Yea, but you didn't actually expect the thread to stay on topic, did you?
Quote
Disliked
Second smaller image is from last week also eurusd. Price came down to the yearly pivot held for a while and then reversed.
Thanks for the info. So you use monthly and yearly as S/R, altho it's not hard&fast since that price often breaks. You like to trade breaks like that it sounds.
Quote
Disliked
I think its you that don't make any sense!!! what do you think traders used before all this electronic trading began, and they made money doing it!!! Do you reasearch before you jump to stupid conclusions!!!
Laff. He did explain why he thinks it's changed tho, ie: no uniform day stop/start. It's an understandable argument, and to be sure things have changed some over the years, but I've just found this one continues working.