Notice: This thread is not a Trading System it does NOT belong in the Trading System because I am NOT going to maintain like other people. I haven't even forward test this to support the "The Clear Method" Trading style. But I do like the logic in the "Clear Method"
This Thread is simply just a discussion not thing more not thing less. If some one want to incorporate THE CLEAR METHOD to their own system or create a new system feel free to do so.
-- End Notice
I searched forex factory and I did not see any one talking about this so I thought I bring it up so people have one more option to trade (as if the current thousand way to trade isn't enough already lol ).
I have attached a pdf of the article by Ron Black that you should be read since it's the original source.
I am just going to straight up copy and paste what : Thomas N. Bulkowski. wrote because I don't feel re-word it myself so it's much faster just give credit where it's due and he did a good job explaining.
----------begin quote
Stock Noise Summary
Tests show that noise occurs about 47% of the time in nearly 600 stocks, and 40% of the time in 100 exchange traded funds (ETFs). The lower noise in ETFs may be due to frequent gapping, forcing price bars "clear" of any congestion region and appearing to trend more often.
Stocks and ETFs with low noise trend the most, suggesting that they represent the best trading vehicles for swing traders.
Just because a stock or ETF has low noise does not mean it trends upward or downward consistently. Frequently, you see tall swings up and down in straight-line runs.
I also found the following to be true. 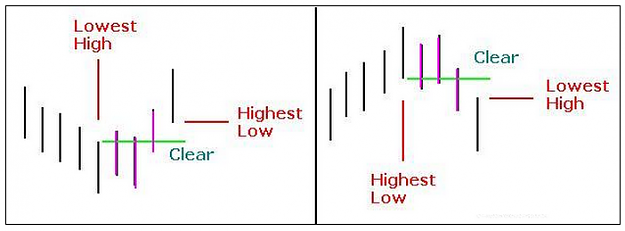
It's easiest to understand the Clear Method using an example. The figure above shows price moving lower in a downtrend. It bottoms in the middle of the left panel, but what's key is the high on that day. That high price is below the prior highs that formed the downtrend. It's the lowest high.
When price climbs enough so that the low is above the lowest high, then the trend has changed from down to up. In other words, the highest low is above (clears) the lowest high. I show that with a green line.
The right panel is similar only it applies to up trends. When the lowest high clears the highest low, the trend is said to change from up to down. Again, the green line shows this.
Enter Noise
The "Clear Method" is used to determine when noise occurs. If, in an uptrend, price makes higher lows, it is trending upward. When it stops making higher lows and before a "clear" trend change occurs, noise takes the place of the trend.
In a downtrend, price makes lower highs. When that stops happening and before a trend change from down to up occurs, noise sets in.
In the above figure, the three bars on each panel with a green line drawn through them are the noise bars. I show them in magenta.
On the left panel, the three magenta bars have highs above the clear bar, but they are not yet clear of the lowest high, so they are noise. When the highest low happens, the trend changes from down to up and noise ends.
On the right panel, the three magenta bars have lower lows than the clear bar, but they are not clear of the lowest high. They are noise bars. When the lowest high occurs, a new trend begins and noise ends.
--- end quote
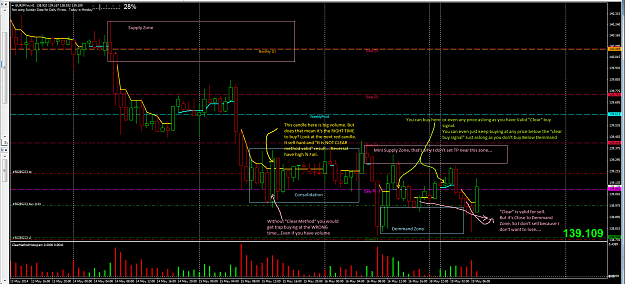
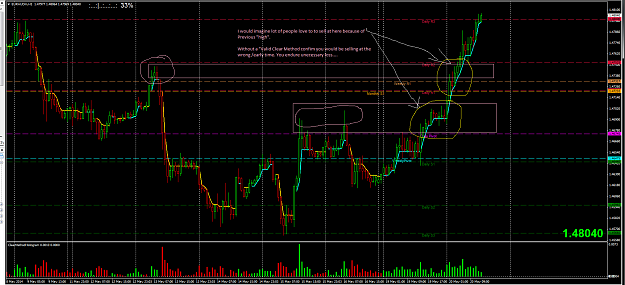
Most of us already see this in our subconscious mind but we don't realize it. To me this method it's like a "breakout of a channel" but the only difference is the point of reference is ONE candle bar not a sample..of 20 candle channel etc....
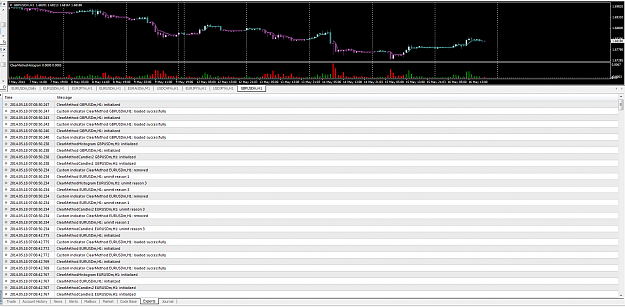
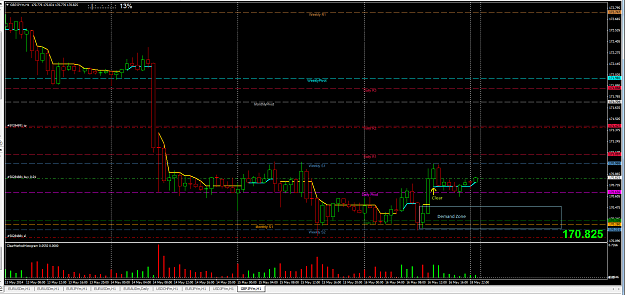
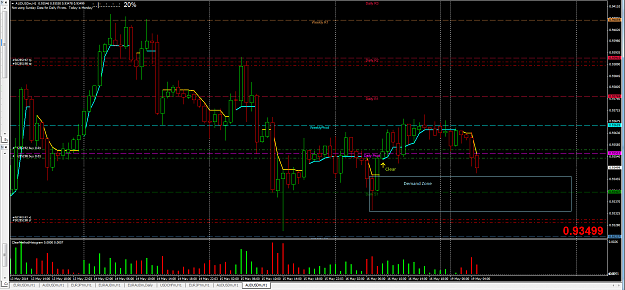
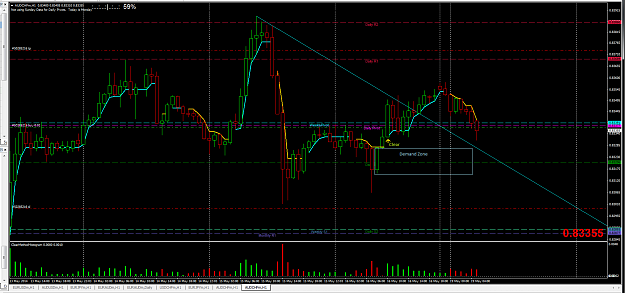
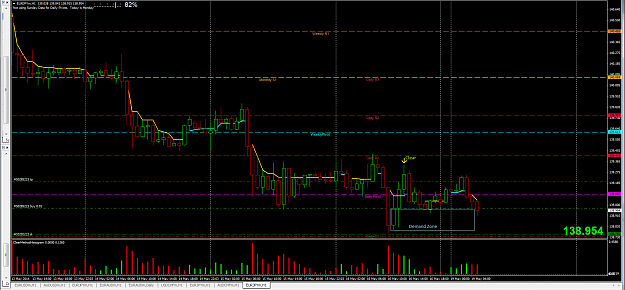
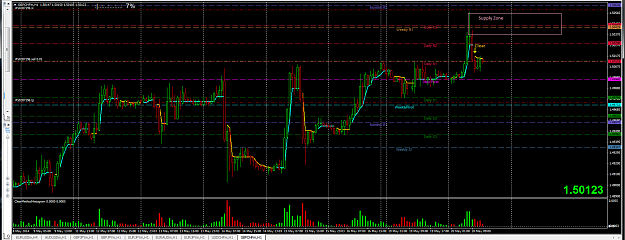
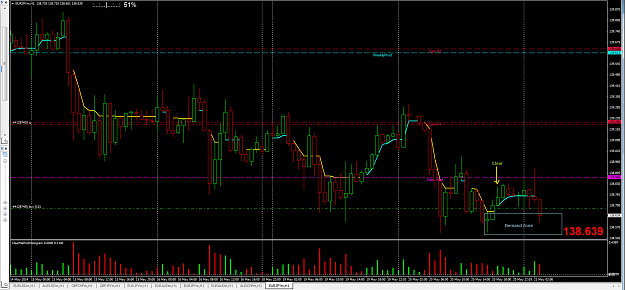
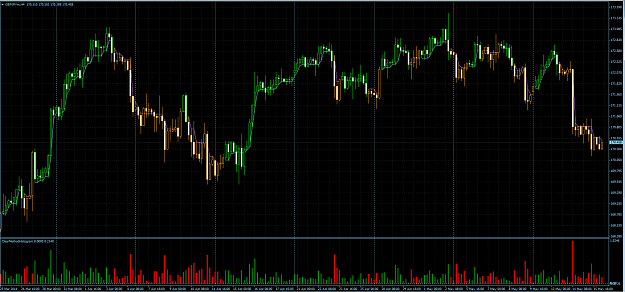
I also found some indicator created by erzo. I'll attach here so people can play around with it if they wish..
Maybe someone will find "The Clear Method" useful.
If some one is interest enough modify the indicators into Multi-TimeFrame Capable. It would good for scalping lower time frame while having the S/R line from higher TF
This Thread is simply just a discussion not thing more not thing less. If some one want to incorporate THE CLEAR METHOD to their own system or create a new system feel free to do so.
-- End Notice
I searched forex factory and I did not see any one talking about this so I thought I bring it up so people have one more option to trade (as if the current thousand way to trade isn't enough already lol ).
I have attached a pdf of the article by Ron Black that you should be read since it's the original source.
I am just going to straight up copy and paste what : Thomas N. Bulkowski. wrote because I don't feel re-word it myself so it's much faster just give credit where it's due and he did a good job explaining.
----------begin quote
Stock Noise Summary
Tests show that noise occurs about 47% of the time in nearly 600 stocks, and 40% of the time in 100 exchange traded funds (ETFs). The lower noise in ETFs may be due to frequent gapping, forcing price bars "clear" of any congestion region and appearing to trend more often.
Stocks and ETFs with low noise trend the most, suggesting that they represent the best trading vehicles for swing traders.
Just because a stock or ETF has low noise does not mean it trends upward or downward consistently. Frequently, you see tall swings up and down in straight-line runs.
I also found the following to be true.
- Bull markets tend to be noisier trending up, and bear markets are noisier trending down.
- ETFs trend more than stocks.
- Weekly data is noisier than daily data.
Stock Noise Background
Ron Black wrote an article in Technical Analysis of Stocks & Commodities magazine, October 2010 titled, "Using Noise." In an earlier article (September 2010, "Getting clear with short-term swings") he discussed his "Clear Method" to determine when a short-term trend changes. In the October article, he uses the Clear Method to detect noise.
The Clear Method
The Clear Method uses the lowest high and highest low to determine when two price bars do not overlap. When they no longer overlap, they are "clear" of one another, and the trend changes from up to down, or down to up.
Attached Image (click to enlarge)
It's easiest to understand the Clear Method using an example. The figure above shows price moving lower in a downtrend. It bottoms in the middle of the left panel, but what's key is the high on that day. That high price is below the prior highs that formed the downtrend. It's the lowest high.
When price climbs enough so that the low is above the lowest high, then the trend has changed from down to up. In other words, the highest low is above (clears) the lowest high. I show that with a green line.
The right panel is similar only it applies to up trends. When the lowest high clears the highest low, the trend is said to change from up to down. Again, the green line shows this.
Enter Noise
The "Clear Method" is used to determine when noise occurs. If, in an uptrend, price makes higher lows, it is trending upward. When it stops making higher lows and before a "clear" trend change occurs, noise takes the place of the trend.
In a downtrend, price makes lower highs. When that stops happening and before a trend change from down to up occurs, noise sets in.
In the above figure, the three bars on each panel with a green line drawn through them are the noise bars. I show them in magenta.
On the left panel, the three magenta bars have highs above the clear bar, but they are not yet clear of the lowest high, so they are noise. When the highest low happens, the trend changes from down to up and noise ends.
On the right panel, the three magenta bars have lower lows than the clear bar, but they are not clear of the lowest high. They are noise bars. When the lowest high occurs, a new trend begins and noise ends.
--- end quote
Most of us already see this in our subconscious mind but we don't realize it. To me this method it's like a "breakout of a channel" but the only difference is the point of reference is ONE candle bar not a sample..of 20 candle channel etc....
I also found some indicator created by erzo. I'll attach here so people can play around with it if they wish..
Attached Image (click to enlarge)
Maybe someone will find "The Clear Method" useful.
If some one is interest enough modify the indicators into Multi-TimeFrame Capable. It would good for scalping lower time frame while having the S/R line from higher TF
Attached File(s)