Nice charts BUT look at the same chart on a higher time frame.
Aslo on your chart the trend was down ....so no going long till trend changes and we get a valid test
Many say they make money using a 5 min chart but it is tough .
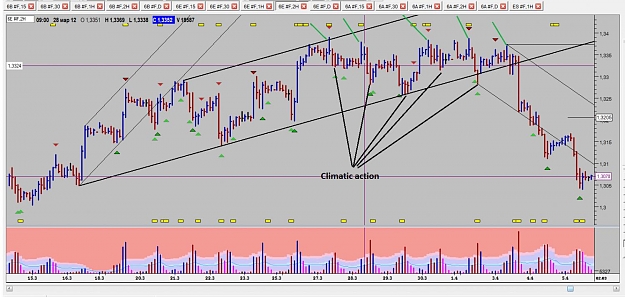
I have been using only a 30 min chart with great success . You can see the biggers picture . The fall of the euro started with a few days of distribution , which ended in a nasty uptrust off 3360
Aslo on your chart the trend was down ....so no going long till trend changes and we get a valid test
Many say they make money using a 5 min chart but it is tough .
I have been using only a 30 min chart with great success . You can see the biggers picture . The fall of the euro started with a few days of distribution , which ended in a nasty uptrust off 3360
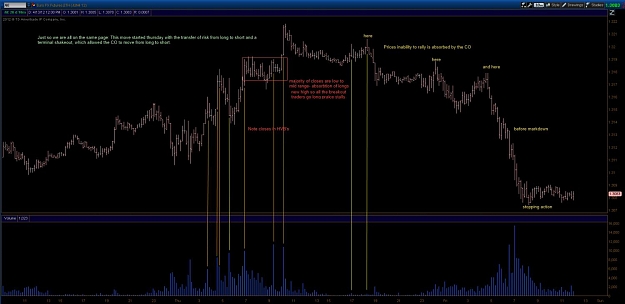
DislikedToday reminded me why HG says he likes to see Stopping Volume or a Selling Climax to look for the start of a setup. There was a long slow drift down after London open with a number of tests that failed or were no result. But none of them were preceeded by a SV or SC on decent spread. Took this screenshot of the first Stopping Volume candle thinking that a reversal may be in the wind. it was only 5 candles later that PA had another formed a base at support with a nice test candle and moved back up. Just found all that very interesting...Ignored
Blogging daily now at www.volume.zone